The Forex market attracts many investors because of the chance to profit from changes in exchange rates. But to trade Forex well, you need to know how to forecast the movement of currency pairs. In this lesson we look at the methods and tools you can use to forecast the market.
Technical analysis
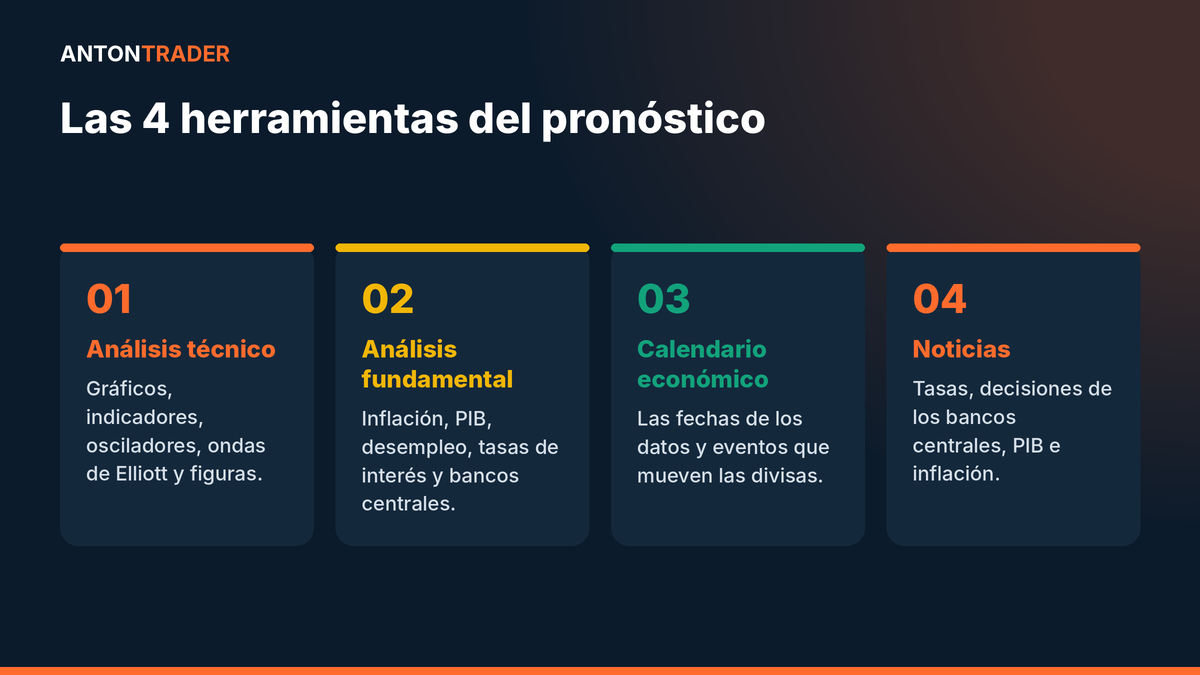
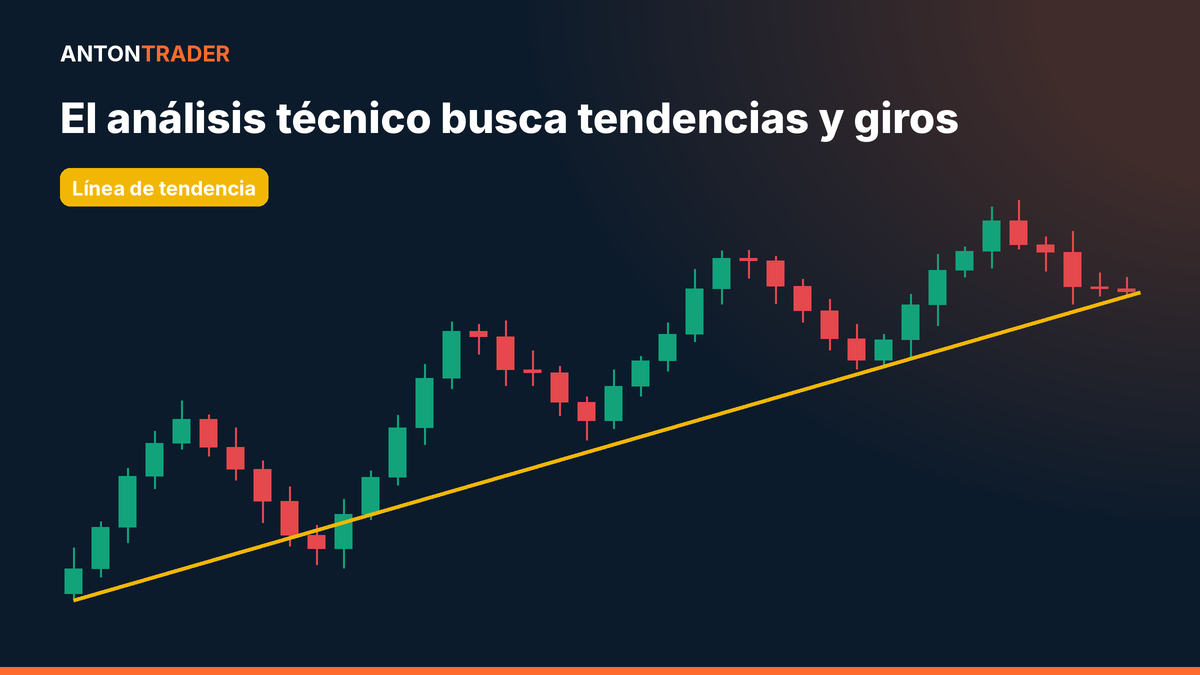
Technical analysis is based on studying price charts and indicators that help you find possible support and resistance levels, as well as spot trends and reversals. Its main tools are:
- Candlestick, bar and line charts;
- Indicators such as moving averages, MACD, RSI and others;
- Oscillators such as the stochastic, the Commodity Channel Index (CCI), etc.;
- Elliott wave theory;
- Chart pattern theory (triangles, flags, pennants, etc.).
Fundamental analysis
Fundamental analysis consists of studying the macroeconomic indicators and events that can influence the exchange rate. Among them are inflation, GDP, unemployment, interest rates, speeches by central bank governors, etc.
By analyzing this data, you can forecast changes in exchange rates.
Economic calendar
The economic calendar is a tool that helps you follow the important economic news and events that affect currency pairs. Knowing these events and their impact on the market can help you forecast the movement of the pairs.
The news context
Following the news is also useful for forecasting the market. Major news, such as changes in interest rates, central bank decisions or GDP and inflation reports, can move currency pairs sharply.
In short: forecasting the Forex market requires a comprehensive approach that combines technical and fundamental analysis, tracking the economic calendar and the news, and using a variety of analysis tools and methods. Only then can you achieve good results in Forex.