The Larry Connors RSI-2 strategy is one of the most famous “short-term” systems in trading: buy a sharp pullback within the trend and exit a few days later. In books it looks like a money-printing machine. I don’t trust books, I trust tests. So I’m not going to retell the book: I coded a robot for MetaTrader 5, ran it through 10 years of history, optimized it using only half of the data and looked at what happened in the years the optimizer never saw. Below are all the numbers, the bad ones and the good ones. And at the end, the free robot.
The idea behind RSI-2
Larry Connors described the system in the book “Short Term Trading Strategies That Work” (2008, with Cesar Alvarez). The logic is simple and a bit counterintuitive:
- Only with the trend. If the price is above the 200-day moving average, we look only for buys. If it is below, only sells.
- We enter on panic. The 2-period RSI (not the classic 14) drops below 5: the market is “oversold” within a couple of days and we buy. If it rises above 95 in a downtrend, we sell.
- We exit fast. As soon as the price closes above the 5-day average, we take the result.
- The original has no stop loss. Connors thought that in this system a stop only worsens the statistics. I left it as in the book, but in the robot you can turn on the stop with a single parameter.
Most people do the opposite: they buy what has already gone up and sell in panic. RSI-2 wins precisely from that mistake of the crowd.
How I ran the test
So there are no doubts about the numbers, first the conditions:
- MetaTrader 5 platform, FxPro demo server, with that broker’s real historical spreads and swaps.
- Period from 01.01.2016 to 01.10.2026, $10,000 deposit, 1:100 leverage.
- Risk of 1% of the balance per trade (the lot is calculated using ATR, so the risk is equal across all instruments).
- Test mode “1 minute OHLC”, more accurate than “open prices only”.
And most importantly: three separate blocks, not one pretty picture.
- Classic. The rules from the book, with no adjustments, on five instruments.
- Optimization using only the years 2016–2022.
- Forward test on 2023–2026. The optimizer didn’t see that data: this is the real test of “how it would have gone in real life”.
Why do it this way? Because any strategy can be fitted to history until the curve looks perfect. I show this in the analysis of the Turtles strategy: there the optimizer found dozens of “profitable” configurations and with new data all of them lost. The only honest test is the forward test.
Block 1. The classic from the book: 4 out of 5 instruments in the red
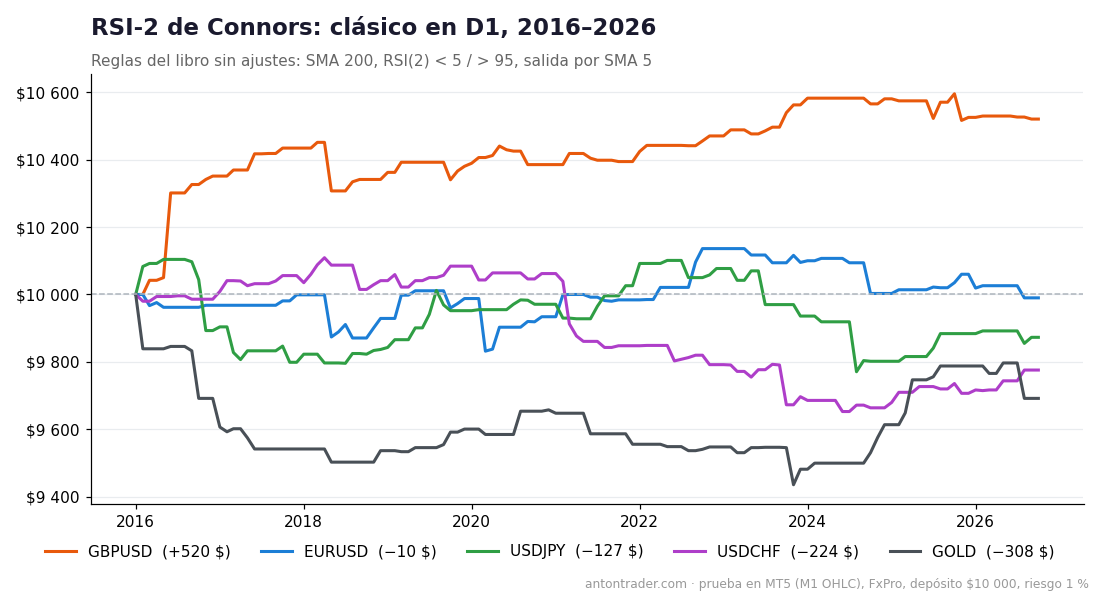
| Instrument (D1) | 10-year result | Profit factor | Max. drawdown | Trades |
|---|---|---|---|---|
| GBPUSD | +$520 | 2.09 | 1.75% | 63 |
| EURUSD | −$10 | 0.99 | 3.38% | 59 |
| USDJPY | −$127 | 0.87 | 4.63% | 58 |
| USDCHF | −$224 | 0.74 | 5.10% | 68 |
| GOLD | −$308 | 0.67 | 6.33% | 47 |
There’s your “money-printing machine”. Rules that worked wonderfully on US stocks in the 1990s and 2000s give zero on currencies and gold in 2016–2026. I see two reasons:
- Too few signals. An RSI(2) below 5 on the daily chart is rare: about 6 trades a year. There are almost no statistics and the result is noise.
- Currencies are not stocks. Stock indices historically go up, and “buying the dip” almost always works there. A currency pair has no built-in growth: trends are shorter and pullbacks can drag on.
The only exception is GBPUSD: +5.2% in 10 years with a drawdown below 2%. It won’t make you rich, but the curve is very smooth. That was the starting point.
Block 2. Optimization on 2016–2022
I moved the system to the 4-hour chart (signals multiply) and let the MetaTrader 5 optimizer choose the parameters. Important: it worked only with the years 2016–2022; I hid the last almost four years from it.
What was optimized: the trend average period, the RSI period, the entry levels and the exit average period. Genetic algorithm, “complex” criterion (it takes into account profit, drawdown and stability).
The best set was not the most “ambitious” one, but the most stable:
| Parameter | Book | Optimization (GBPUSD H4) |
|---|---|---|
| Trend average | SMA 200 | SMA 300 |
| RSI period | 2 | 5 |
| Buy if RSI is below | 5 | 20 |
| Sell if RSI is above | 95 | 80 |
| Exit by average | SMA 5 | SMA 15 |
| Stop loss | no | no |
Result in 2016–2022: +$1,256 (+12.6%), profit factor 1.40, maximum drawdown 4.2%, 157 trades, 66% winners.
On its own this means nothing: you can fit anything. That’s why the most interesting part comes now.
Block 3. Forward: what would have happened since 2023
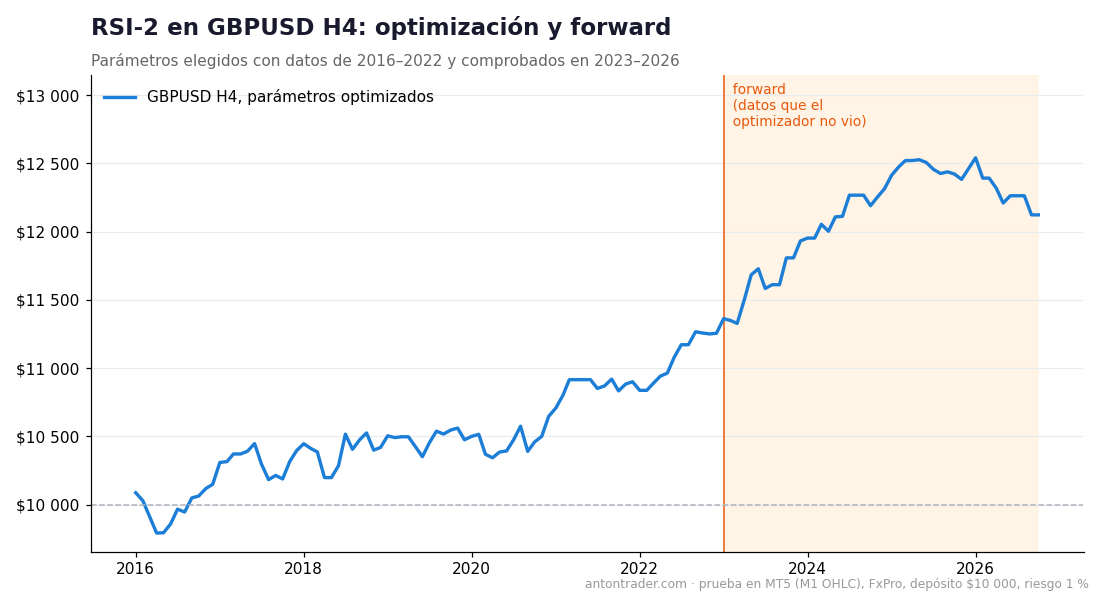
The same parameters, unchanged, with data from 2023 to October 2026:
| Period | Result | Profit factor | Max. drawdown | Trades | Winners |
|---|---|---|---|---|---|
| 2016–2022 (optimization) | +$1,256 | 1.40 | 4.19% | 157 | 65.6% |
| 2023–2026 (forward) | +$729 | 1.43 | 4.70% | 84 | 66.7% |
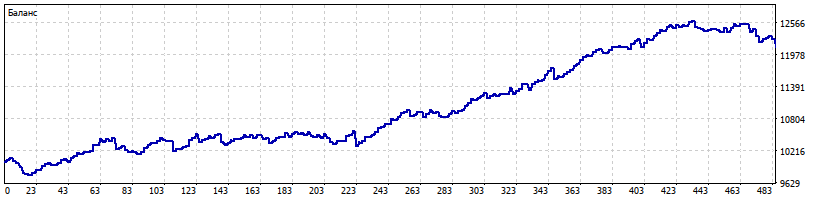
| Full period 2016–2026 | +$2,123 | 1.42 | 4.66% | 241 | 66.0% |
This is already serious. With “unseen” data the system didn’t collapse: the profit factor even ended up slightly above the optimization one, the percentage of winning trades is the same and the drawdown is almost identical. Swaps over the 10 years cost $207: in a short-term strategy they hardly matter.
And it’s not just one lucky combination. Of the 58 parameter sets that won in 2016–2022, 41 stayed positive in the forward test. For comparison: with the Turtles on USDJPY the optimizer found 77 “profitable” sets and none survived the forward test. On EURUSD H4 the picture is similar to the pound: 16 out of 18. That means the system has a real edge, not a fit to history.
What this means in practice
No illusions. +$2,123 on $10,000 over ten years is about 2% a year with a 1% risk per trade. A term deposit pays more. So why bother with all this?
- It’s a “skeleton” that works. The edge was confirmed on out-of-sample data, so it can be scaled: raise the risk, add pairs (EURUSD H4 also passed the test), run it on several accounts.
- With a 3% risk per trade the same curve gives roughly triple the result and triple the drawdown: about 14%. That’s already interesting, but the decision is yours and only after testing it on a demo account.
- The system doesn’t get in the way of manual trading. 20–25 trades a year, each position lives a few days. You put it on a VPS and forget about it.
If you optimize the robot periodically, for example once a year using the last 5–7 years and always checking with a forward test, you can keep it in shape even as the market changes. The optimized parameters in the file are an example of the result this approach gives.
Where to run the robot
The robot is built for MetaTrader 5 and works with any broker that offers this platform. I tested it on FxPro: all the numbers in this article come from its servers. The other brokers in my ranking also work: RoboForex and Tickmill.
Keep in mind that swaps and spreads vary from one broker to another, so your result will be a little different from my test. For the first few weeks, demo only.
Download the RSI-2 robot for free
The robot is free for clients of the brokers in my ranking. How to get it:
- Open a MetaTrader 5 account with one of the brokers above (or use the one you already have).
- Go to my Telegram bot with the button below and send your account number.
- After verification, the bot sends you the file: the robot, Connors’ classic parameters and my own optimized ones for GBPUSD H4, plus installation instructions.
🤖 Download the robot for free on Telegram
My conclusion
RSI-2 in its original form doesn’t work on currencies. That’s an honest result and I’m not going to pretend otherwise. But the idea of “buying panic with the trend” is alive: after moving it to H4 and optimizing it carefully, the system passed the most important test, the one on the years it hadn’t seen. It’s not a magic button, it’s a tool with a small but confirmed edge. Those are exactly the systems that last.
Try it yourself, start on a demo account and keep your risk under control. Backtest results do not guarantee future results.
Sources
- Larry Connors, Cesar Alvarez — “Short Term Trading Strategies That Work”, 2008.
- Own tests in MetaTrader 5 on the FxPro demo server, October 2026.
Where to trade
These are the brokers and exchanges I use that work with clients from Latin America. Always check that the service is available in your country and start small.
Risk warning: CFDs, Forex and crypto derivatives carry a high risk of losing money due to leverage. This article is not investment advice.