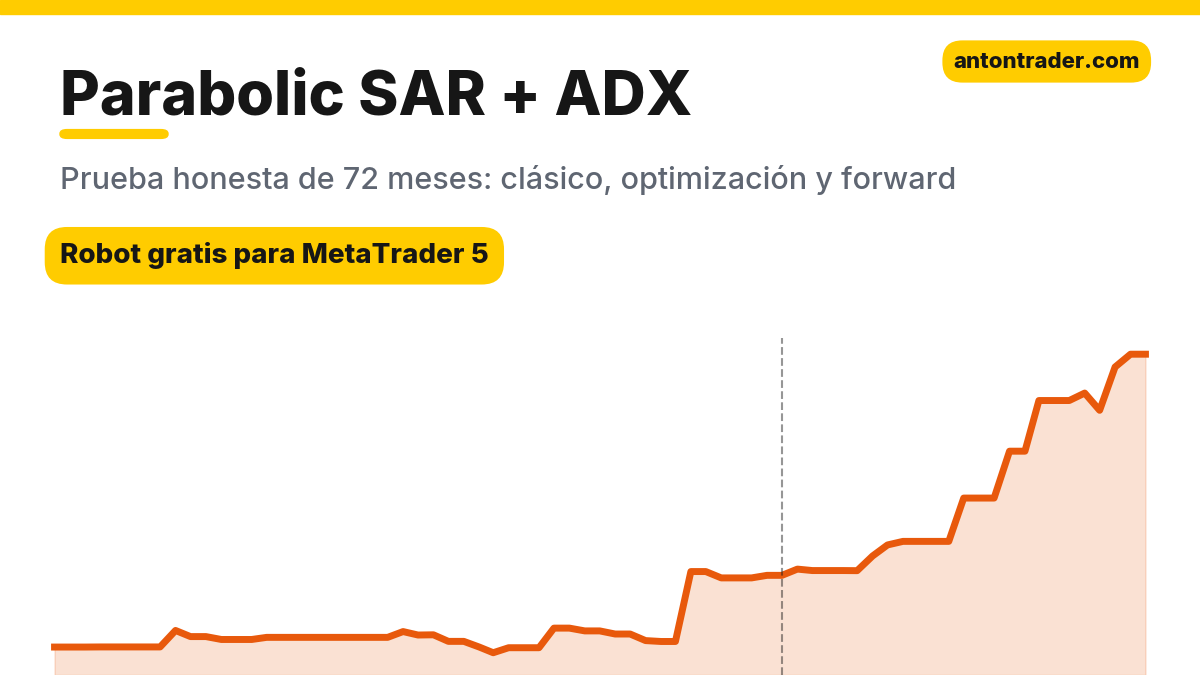
In 1978, with a single book, J. Welles Wilder gave traders half of the indicators that every platform has today: RSI, ATR, ADX and Parabolic SAR. The combination “the SAR gives the entry point and the ADX confirms the trend” is a classic of manuals and videos. I coded a MetaTrader 5 robot following the rules to the letter and ran it on seven markets over 72 months. In forex: zero or a loss. But on gold D1, Wilder’s pure classic, without a single adjustment, passed the test of the future better than any optimized version. It’s that rare case where the optimizer loses to the strategy’s author. The numbers, trade examples and the robot are below.
The strategy rules
The Parabolic SAR consists of dots above or below the price that get closer to the price with each day of the trend. If they jump to the other side, the trend has changed. The ADX shows the strength of the trend, and the +DI and −DI lines show its direction. The mechanical version I tested:
- Signal. At the daily close, the SAR dots (step 0.02, maximum 0.2) jump below the price: buy; above it: sell.
- Trend filter. Enter only if the ADX(14) is above 25 and the direction line confirms the signal: for buys, +DI above −DI; for sells, the opposite.
- Stop loss at the SAR level. Each day the stop moves to the new SAR point. No take profit: the exit comes when the SAR flips again.
- Position size is calculated to risk 1% of the balance down to the stop.
- D1 timeframe, buys and sells.
In Wilder’s original, the SAR is an “always in the market” system: if it flips, you flip your position. The ADX > 25 filter was added by traders to avoid trading ranges, and that’s how the combination is almost always presented. It’s a trend system, like the Turtles: it wins rarely, but big.
What it looks like on the chart
Below are two real trades from the robot, from the gold D1 test. They come from the optimized variant (ADX > 15, buys only, take profit of 2 stops): it has more trades, and the entry and stop mechanics are the same as in the classic. Both are from the forward period.
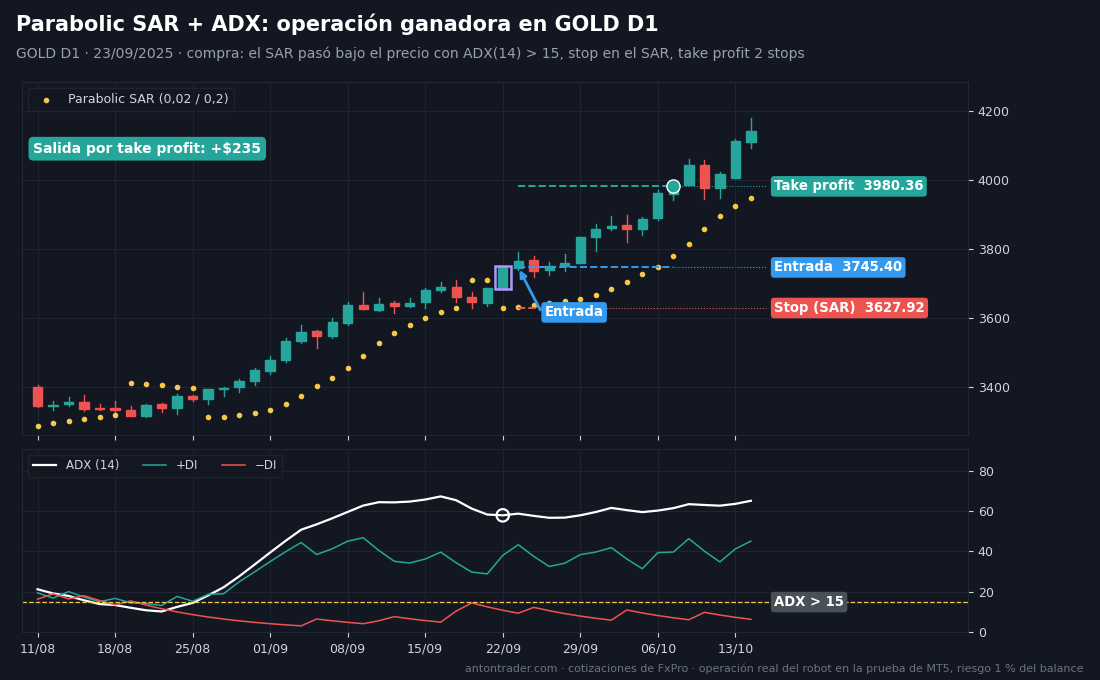
Winning trade. On September 22, 2025, the SAR dots jumped below the gold price, with the ADX above 50: a trend at full power. On September 23 the robot bought at 3745.40. Stop loss at the SAR point, 3627.92; take profit twice as far, at 3980.36. While the price rose, the SAR approached from below each day. The target was hit on October 7: +$235.
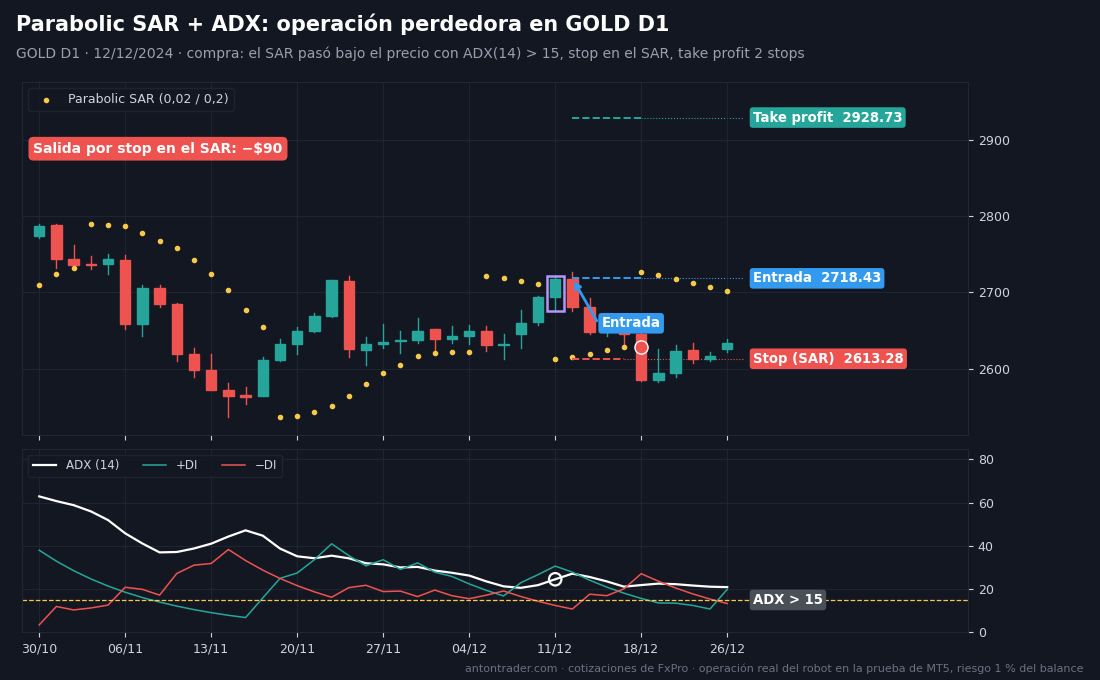
Losing trade. On December 11, 2024, the SAR flipped below the price, ADX near 25, +DI above −DI: all conditions in place. On December 12, a buy at 2718.43, stop loss at the SAR, 2613.28. The rally never came: the price fell while the SAR rose to meet it. On December 18 the price broke the trailed stop and the exit was at 2628.20: −$90. The stop that kept tightening left the loss below the planned 1%.
Doing it manually is exactly the same: on the daily chart, turn on the Parabolic SAR (0.02 / 0.2) and the ADX(14). Wait for the day when the SAR dots jump below the candles, with the ADX above 25 and the green +DI above the red −DI. Buy at the next day’s open, put the stop loss at the SAR point and move it every day to the new point. If the dots jump above the price, close the trade.
How I ran the test
- MetaTrader 5 Strategy Tester, FxPro demo server: the broker’s real quotes, spreads and swaps.
- Period from October 2020 to September 2026, exactly 72 months. $10,000 deposit, 1:100 leverage, 1% risk per trade.
- “1 minute OHLC” mode, the closest to reality among the tester’s fast modes.
I’ll explain at the end why 72 months and not 10 or 20 years: old years describe a different market. Three blocks: the classic with no adjustments → optimization using only 10/2020–09/2024 → verification on 10/2024–09/2026, months the optimizer never saw.
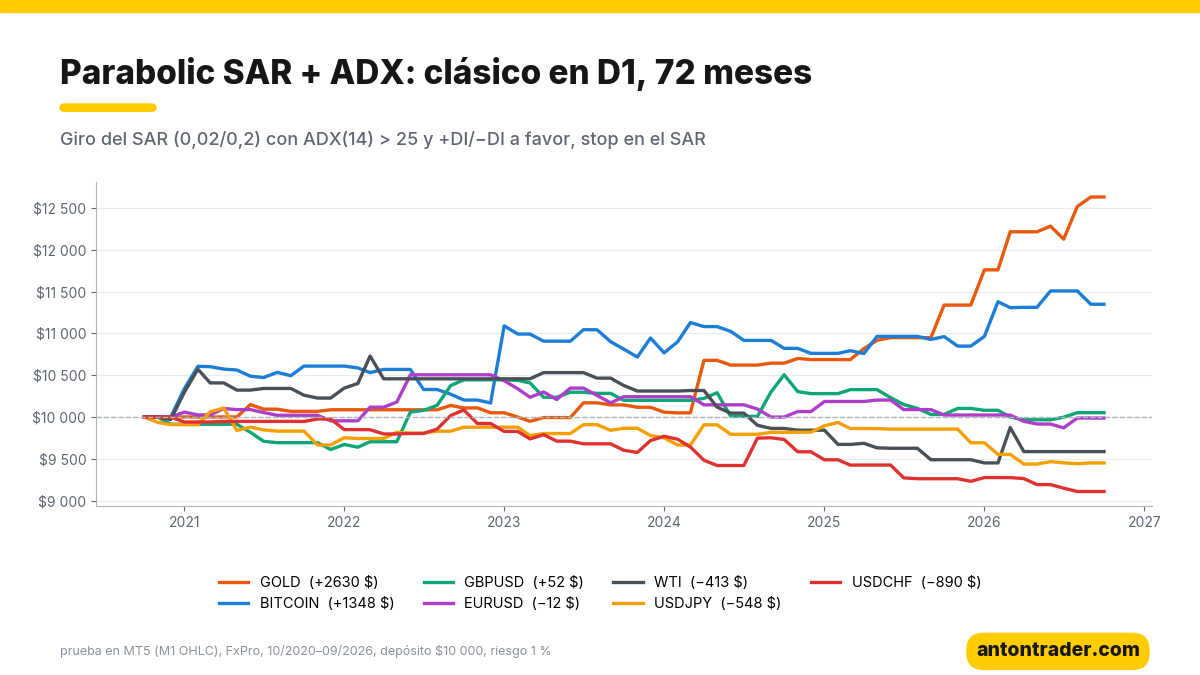
Block 1. The classic over 72 months: gold and bitcoin versus forex
| Instrument (D1) | Result over 72 months | Profit factor | Max. drawdown | Winning trades | Swaps |
|---|---|---|---|---|---|
| GOLD | +$2,630 | 4.48 | 6.2% | 58% | −$339 |
| BITCOIN | +$1,348 | 1.57 | 6.4% | 32% | −$567 |
| GBPUSD | +$52 | 1.03 | 7.6% | 42% | −$125 |
| EURUSD | −$12 | 0.99 | 7.7% | 48% | −$105 |
| WTI (oil) | −$413 | 0.80 | 15.4% | 29% | −$89 |
| USDJPY | −$548 | 0.72 | 8.4% | 44% | −$249 |
| USDCHF | −$890 | 0.57 | 11.1% | 33% | −$299 |
The ADX filter is strict: between 36 and 62 trades per market in six years. What stands out:
- Forex, no. On the pound and the euro, zero; on the yen and the franc, a loss. There are trends in the major pairs, but the SAR flips too many times within them and kicks you out of the position.
- Gold is the star of the test. +$2,630, profit factor 4.48, drawdown of just 6.2%. 58% of trades are winners: for a trend system, that’s a lot.
- Bitcoin stays positive, but with 32% winning trades: the robot lives off a few big moves.
- Drawdowns are low everywhere, except in oil. The stop loss at the SAR tightens quickly and doesn’t let much profit slip away.
Block 2. Optimization on 10/2020–09/2024
I optimized on GOLD D1 and BITCOIN D1. I tuned the SAR step and maximum, the ADX period (10–22), the ADX threshold (0–35), the +DI/−DI filter, the take profit from 0 to 3 stops, and whether sells are allowed.
- GOLD D1: of the sets with 15+ trades, 124 were profitable in training and of those, 93 stayed positive in the forward test. On gold the idea is stable.
- BITCOIN D1: 91 sets were profitable in training; in the forward test, only 27 stayed positive. The best training set (+$2,395) made $404 in the forward test, and the second one ended in a loss. It’s the classic overfitting trap: on bitcoin I wouldn’t trust the optimized parameters.
For gold I took the most stable set, the one closest to the classic:
| Parameter | Wilder’s classic | Optimization (GOLD D1) |
|---|---|---|
| Parabolic SAR | 0.02 / 0.2 | 0.02 / 0.2 |
| ADX(14) filter | above 25 | above 15 |
| +DI/−DI filter | yes | no |
| Direction | buys and sells | buys only |
| Stop loss | SAR, trailed every day | SAR, trailed every day |
| Take profit | none, exit on SAR flip | 2 stops or SAR flip |
Block 3. Forward 10/2024–09/2026
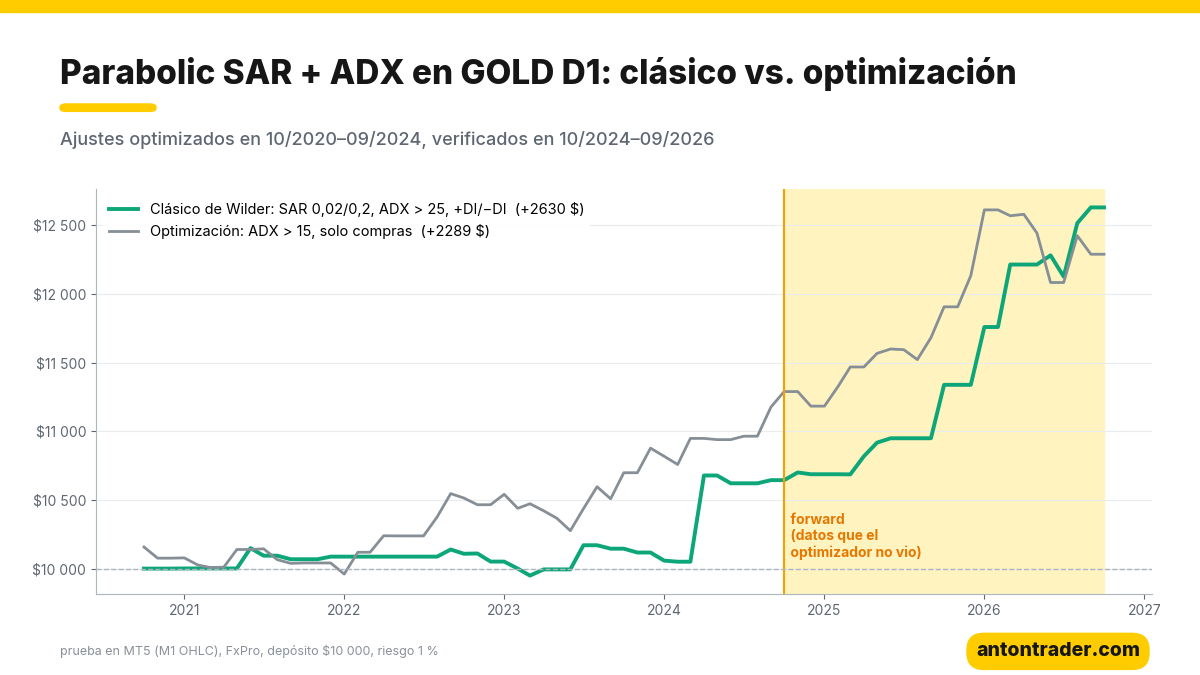
| Variant | Period | Result | Profit factor | Max. drawdown | Trades |
|---|---|---|---|---|---|
| Classic | 10/2020–09/2024 | +$644 | 2.18 | 3.6% | 23 |
| Optimization | 10/2020–09/2024 | +$1,177 | 2.10 | 4.3% | 41 |
| Classic | 10/2024–09/2026 (forward) | +$1,985 | 10.35 | 6.5% | 13 |
| Optimization | 10/2024–09/2026 (forward) | +$1,112 | 2.29 | 8.2% | 20 |
Each period was tested separately, starting with $10,000. The outcome:
- The optimization won the past and lost the future. In training it earned almost double the classic; in the forward test, almost half: +$1,112 versus +$1,985.
- Wilder’s classic passed the forward test with a profit factor of 10.35. It’s a nice number, but the sample is small: just 13 trades. It should be read as “the system caught the trend and didn’t get in its way,” not as an expectation for the future.
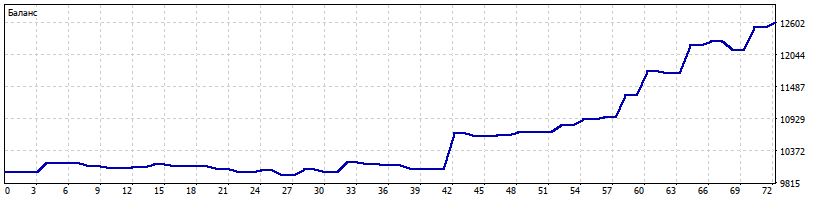
- Over the full 72 months the classic made +$2,630 on $10,000, profit factor 4.48, drawdown up to 6.2% and 36 trades, about 6 per year. The optimization: +$2,289 with a 7.4% drawdown and 61 trades.
- Costs: before swaps and commissions the classic earned $2,972, and swaps took $339. In the optimization, with almost double the trades, swaps were $848.
That’s why the main set in the file is the classic. The optimized one comes alongside for anyone who wants more trades, but the test didn’t show that it’s better.
The risks, no makeup
- Almost all of the profit is gold’s 2024–2026 trend. In 2021–2023, when gold was in a range, the robot spent four years near zero. A new range will bring a new streak of small losses.
- Few trades. About 6 per year. A pause of several months is normal.
- It works in a narrow space. In my tests, gold D1. On the major pairs the classic ends at zero or at a loss, and on bitcoin the optimization didn’t pass the verification.
- Gaps. The stop loss at the SAR sits close. A strong gap at the weekly open can get you out worse than planned.
Where to run the robot
The robot works on MetaTrader 5 with any broker that offers gold (GOLD/XAUUSD). My test was done on FxPro. The other brokers in my ranking also work: RoboForex and Tickmill. Before launching it, compare gold swaps: the system holds positions for weeks.
Download the “Parabolic SAR + ADX” robot for free
The robot is free for clients of the brokers in my ranking:
- Open a MetaTrader 5 account with one of the brokers above (or use the one you already have).
- Enter the Telegram bot with the button and send your account number.
- After verification, the bot sends you the file: the robot, Wilder’s classic parameters (the main ones for GOLD D1) and the optimized ones as an alternative, plus the instructions.
📊 Download the robot for free on Telegram
My conclusion
Parabolic SAR + ADX in forex is pretty little dots on the chart and zero in the account. The major pairs flip too often within the trend, and the SAR can’t keep up with them. Anyone who trades this combination on EURUSD because it was shown that way in a video is paying the market for the picture.
But on gold something strange happened: rules from almost half a century ago, without a single adjustment, beat the optimizer on data from the future. The optimization found more trades in the past, but those trades turned out to be noise. Sometimes the best thing you can do with a strategy is not touch it and let it trade where there’s a trend.
Today I also published the analysis of Elder’s Triple Screen, where exactly the opposite happens: the classic ran out of steam and the optimized version passed the forward test. Other analyses: the inside bar breakout (which also found its money on gold D1), the “golden cross” and Connors’ RSI-2.
Why 72 months?
The market changes fundamentally every 3–5 years: the participants and the volatility change, and trends give way to ranges. Gold in this test is a clear example. From 2020 to 2023 it moved in a channel of roughly $1,600–2,100, and Wilder’s trend system went four years without going anywhere. Starting in 2024 a different market began, a long rally above $4,000, and the same system, unchanged, started to pay. A 10–20 year test would have diluted those cycles into a single average figure. You have to choose a strategy for the market that exists now, and change it when the market changes.
That’s why I made my app “Find your strategy”, in the browser or on Telegram. There you can test any idea on up to 72 months of history, and every 2 weeks the app runs tens of thousands of strategies on its own and shows you the ones that work over the last 6, 12 and 36 months. It doesn’t promise profits: it shows you which strategies are still alive in the current market.
Backtest results on historical data do not guarantee future results.
Sources
- J. Welles Wilder Jr. — “New Concepts in Technical Trading Systems”, 1978: Parabolic SAR, ADX, +DI/−DI.
- Own tests in MetaTrader 5 on the FxPro demo server, October 2026.
Where to trade
These are the brokers and exchanges I use and that work with clients from Latin America. Always check that the service is available in your country and start small.
Risk warning: CFDs, Forex and crypto derivatives carry a high risk of losing money due to leverage. This article is not investment advice.