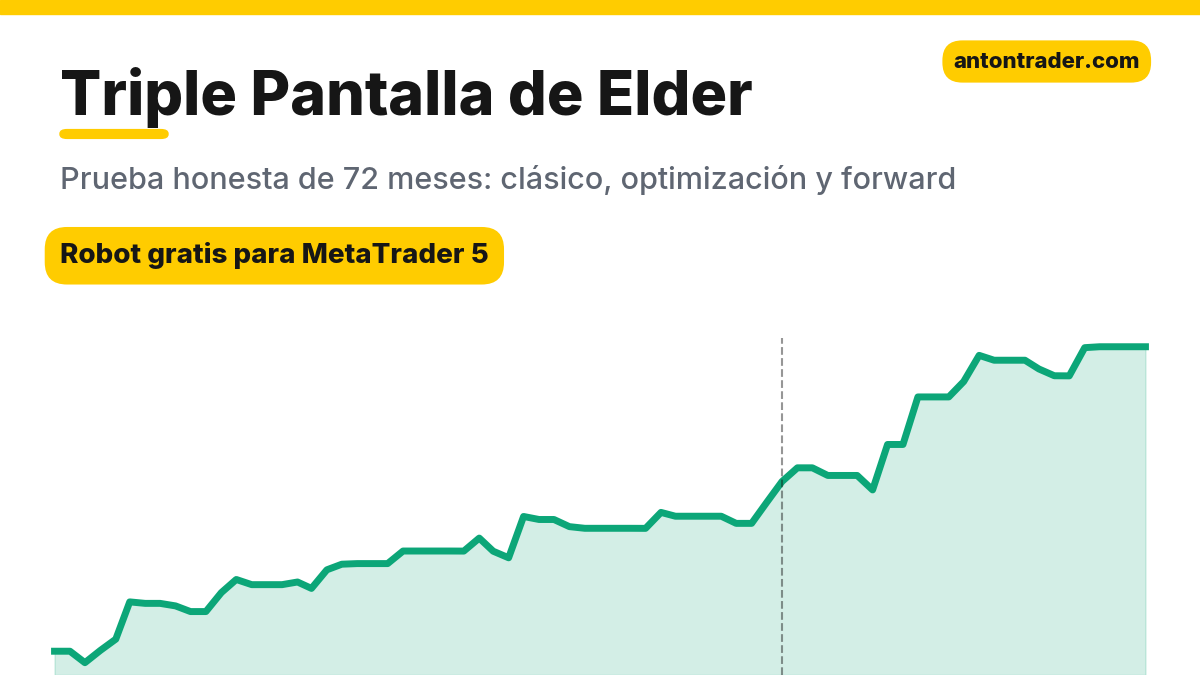
Alexander Elder’s Triple Screen is one of the most respected systems in trading. Three filters instead of one: the trend on the higher timeframe, the pullback on the working timeframe, and entry with a stop order. It sounds like protection against every beginner mistake. I programmed a MetaTrader 5 robot following Elder to the letter and ran it on seven markets over 72 months. The result is uncomfortable for the legend: on three of the seven markets the classic loses, and on EURUSD the drawdown reaches 38%. And on USDJPY, where it earned the most, almost all of the profit stayed in the past: in the forward test the classic barely stays positive. But a single adjustment turned this system into one that works. The numbers, example trades and the robot are below.
The strategy rules
Elder described the system in “Trading for a Living” (1993; in Spanish, “Vivir del trading”) and in more detail in “Come Into My Trading Room” (2002). The idea: every signal is checked on three timeframes. The mechanical version I tested:
- Screen 1: the “tide.” Weekly chart, MACD histogram (12, 26, 9). If the last closed bar is above the previous one, we look only for buys; if it is below, only for sells.
- Screen 2: the “wave.” Daily chart, an oscillator against the tide. Elder proposes the Force Index with EMA 2: in an uptrend we wait for it to drop below zero (pullback); in a downtrend, for it to rise above zero.
- Screen 3: the “ripple.” Entry is not at market: Buy Stop above the high of the pullback day (for sells, Sell Stop below the low). If it is not triggered, the next day the order is moved to the new high as long as the signal is still alive.
- Stop below the low of the last two days. No take profit: the exit comes when the weekly histogram turns against the position.
- Position size is calculated to risk 1% of the balance per trade. Elder is the author of the “2% rule”; I take half, out of prudence.
The robot only looks at closed weeks and days: no peeking into the future. The weekly trend filter makes this system a relative of MACD + EMA 200, except that here the MACD works on the higher timeframe and the entry is made on the pullback.
What it looks like on the chart
Below are two real trades by the robot, from the USDJPY D1 test with the optimized parameters (Force Index 4, buy-only, take profit of 3 stops). Both are from the forward period, which the optimizer did not see.
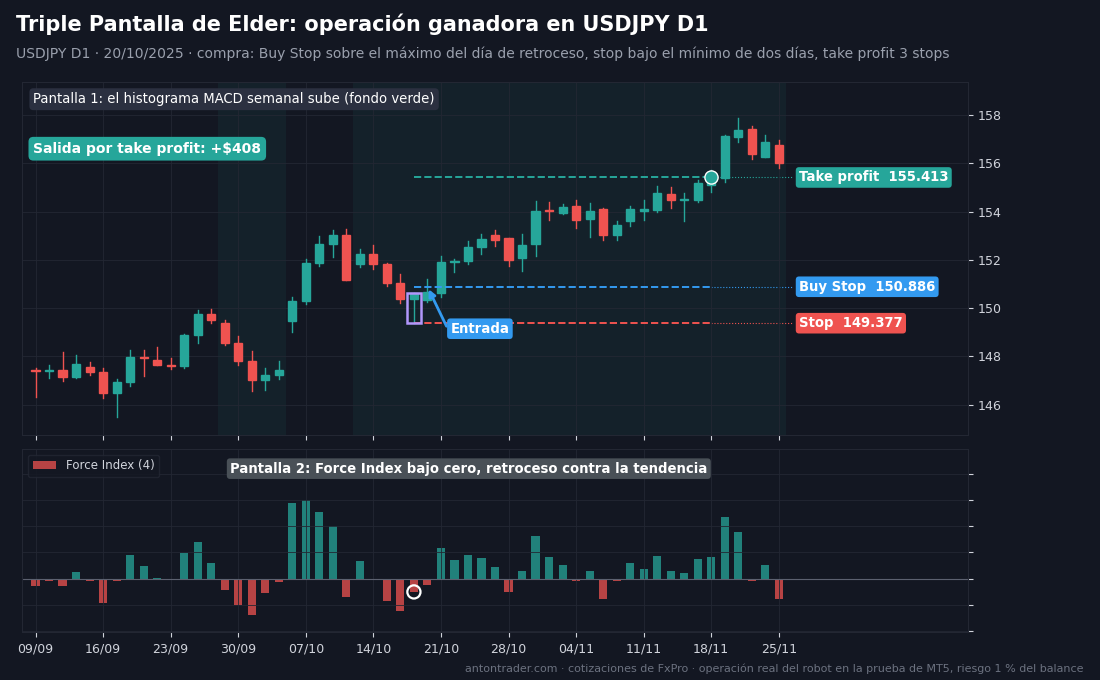
Winning trade. In the fall of 2025 the weekly MACD histogram of USDJPY was rising: buys only. On October 17 the dollar pulled back and the Force Index dropped below zero. A Buy Stop was placed above that day’s high, and it was triggered on October 20 at 150.886. Stop below the two-day low, at 149.377; take profit three times farther away, at 155.413. The target was hit on November 18: +$408.
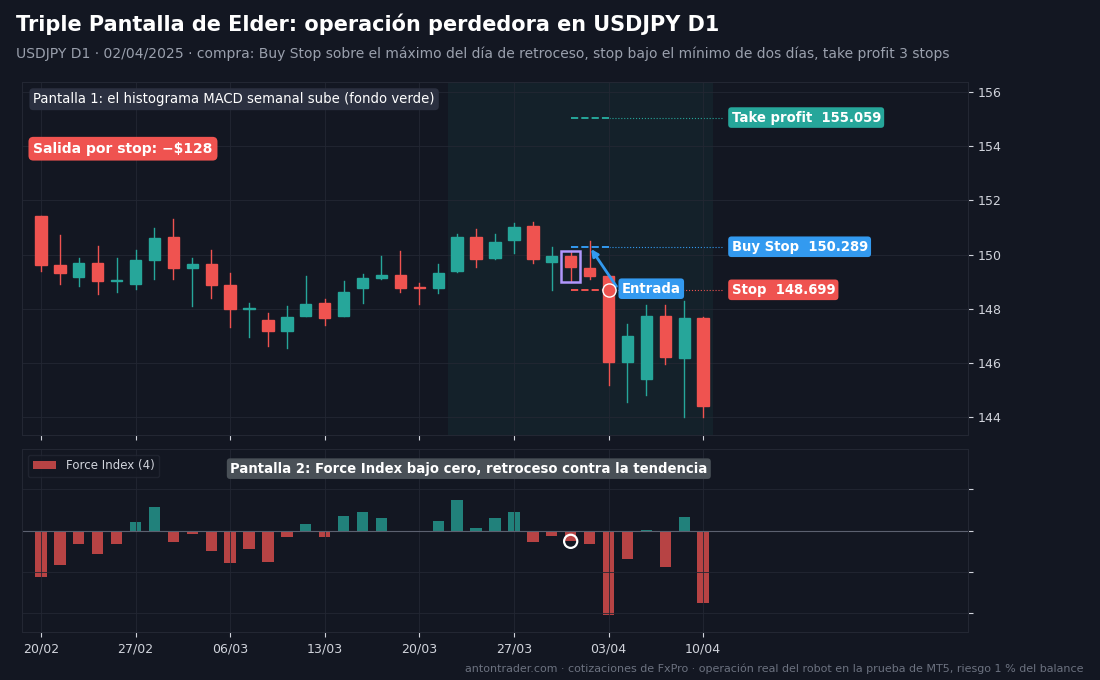
Losing trade. April 1, 2025, the same picture: weekly tide up, daily pullback, Force Index below zero. On April 2 the Buy Stop was triggered at 150.289, with the stop at 148.699. The next day the market reversed downward and hit the stop in a single candle: −$128. Why it reversed doesn’t matter. What matters is that the stop was in place, the loss stayed within 1% of the deposit, and a single winner with a 3-stop take profit covers three losses like this one.
Doing it manually is exactly the same: open the weekly chart with the MACD histogram and confirm that the last closed bar is above the previous one. Switch to the daily, wait for the Force Index to drop below zero and place a Buy Stop above that day’s high, with the stop below the two-day low. If it isn’t triggered, tomorrow you move it to the new high.
How I ran the test
- MetaTrader 5 Strategy Tester, FxPro demo server: the broker’s real quotes, spreads and swaps.
- Period from October 2020 to September 2026, exactly 72 months. $10,000 deposit, 1:100 leverage, 1% risk per trade.
- “1 minute OHLC” mode, the closest to reality among the fast tester modes.
I’ll explain at the end why 72 months and not 10 or 20 years: in that time the market manages to change, and old years only muddy the picture. Three blocks: the classic with no adjustments → optimization using only 10/2020–09/2024 → verification on 10/2024–09/2026, months the optimizer did not see.
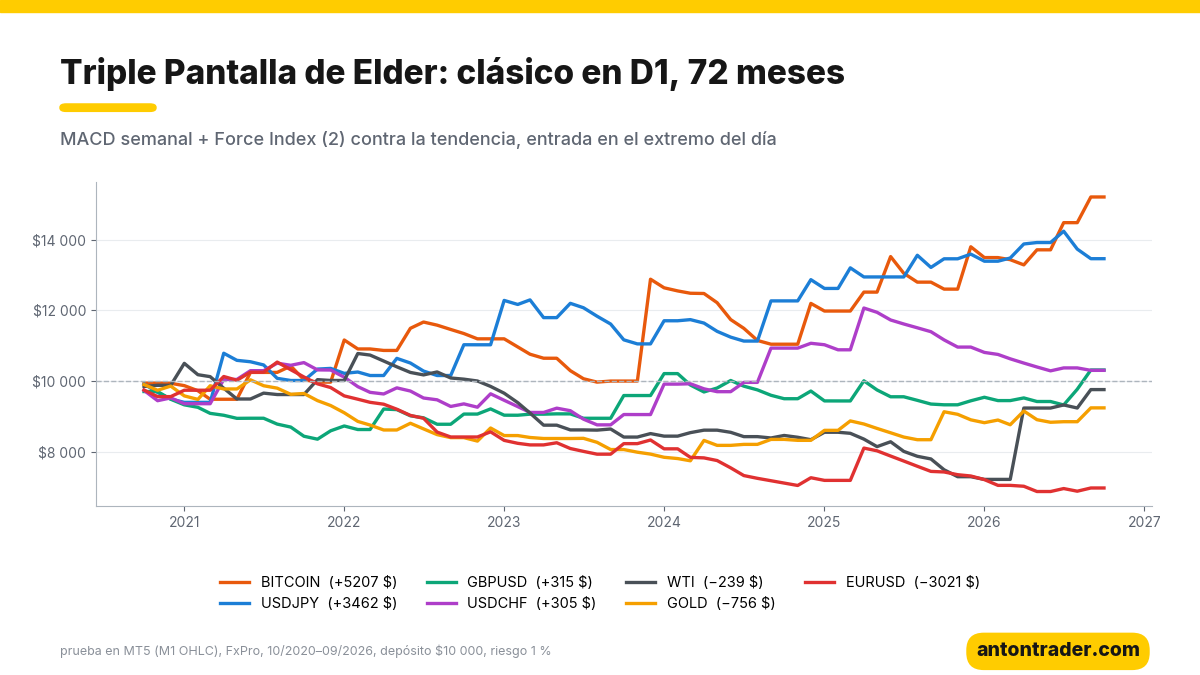
Block 1. The classic over 72 months: two positive, two flat, three losing
| Instrument (D1) | Result over 72 months | Profit factor | Max. drawdown | Winning trades | Swaps |
|---|---|---|---|---|---|
| BITCOIN | +$5,207 | 1.74 | 19.4% | 23% | −$2,685 |
| USDJPY | +$3,462 | 1.41 | 15.2% | 28% | −$1,632 |
| GBPUSD | +$315 | 1.05 | 17.2% | 29% | −$605 |
| USDCHF | +$305 | 1.05 | 19.8% | 23% | −$1,471 |
| WTI (oil) | −$239 | 0.96 | 34.3% | 24% | −$1,763 |
| GOLD | −$756 | 0.88 | 24.9% | 22% | −$1,090 |
| EURUSD | −$3,021 | 0.58 | 38.3% | 18% | −$554 |
Between 90 and 114 trades on each market: the statistics are sufficient. What they say:
- Three screens don’t save you from drawdown. On EURUSD, 38%; on oil, 34%. The two-day stop is tight, winning trades are only 18–29%, and with no take profit, gains are often given back before the week turns.
- Swaps eat the system. The robot holds positions for weeks, and on all seven markets swaps took between $554 and $2,685. Without them, the franc and oil would have ended positive by more than $1,500.
- Bitcoin leads, but with fine print. +$5,207 with a 19% drawdown and 23% winning trades. It’s a bet on a few big trends, not steady work.
- USDJPY is the most stable positive. I went into optimization with it.
Block 2. Optimization on 10/2020–09/2024
I optimized on USDJPY D1 and BITCOIN D1. I adjusted the weekly MACD periods (8–16 / 20–32 / 5–9), the Force Index period (2–4), the stop behind 1–3 days, the take profit from 0 to 3 stops, the exit on weekly turn, and whether sells are allowed.
- USDJPY D1: of the sets with 20+ trades, 138 were profitable in training and of those 126 stayed positive in the forward test. In almost all of the best sets, sells are turned off.
- BITCOIN D1: in the forward test almost all profitable sets survived (50 of 51), but the best ones earned little in training: profit factor of 1.2–1.6 with drawdowns of up to 18%. No set stronger than the classic appeared.
For USDJPY D1 I chose the set closest to the classic, with three changes:
| Parameter | Classic | Optimization (USDJPY D1) |
|---|---|---|
| Screen 1 | weekly MACD histogram (12, 26, 9) | weekly MACD histogram (12, 26, 9) |
| Screen 2 | Force Index (2) | Force Index (4) |
| Direction | buys and sells | buy-only |
| Entry | stop order at the extreme of the pullback day | stop order at the extreme of the pullback day |
| Stop | behind the two-day extreme | behind the two-day extreme |
| Take profit | none, exit on weekly turn | 3 stops or weekly turn |
Block 3. Forward 10/2024–09/2026
| Variant | Period | Result | Profit factor | Max. drawdown | Trades |
|---|---|---|---|---|---|
| Classic | 10/2020–09/2024 | +$2,499 | 1.45 | 15.2% | 62 |
| Optimization | 10/2020–09/2024 | +$2,337 | 2.15 | 5.1% | 39 |
| Classic | 10/2024–09/2026 (forward) | +$337 | 1.15 | 8.9% | 29 |
| Optimization | 10/2024–09/2026 (forward) | +$2,041 | 4.05 | 4.6% | 18 |
Each period was tested separately, starting with $10,000. The result:
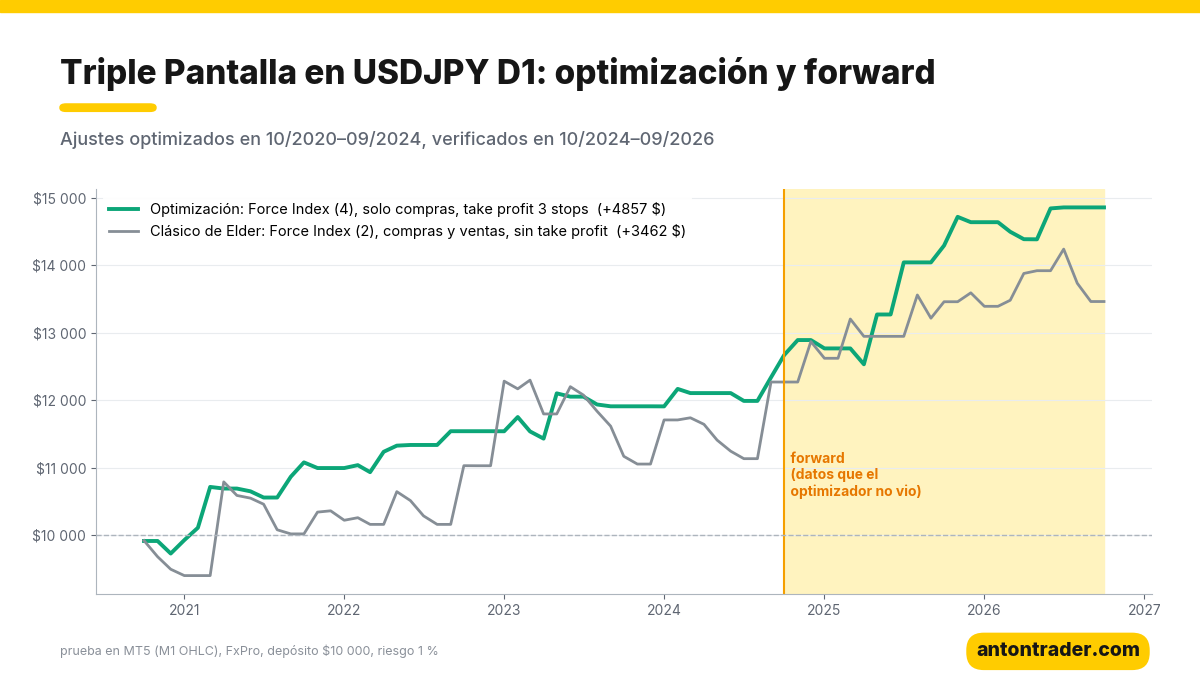
- The classic ran out of steam. In training +$2,499; in the forward test, barely +$337, with a profit factor of 1.15. Six years in positive territory, but the last two it worked for the broker and for the swaps.
- The optimization passed the forward test better than training: +$2,041 and a profit factor of 4.05 over 24 months the optimizer did not see. Winning trades in the forward test were 61%.
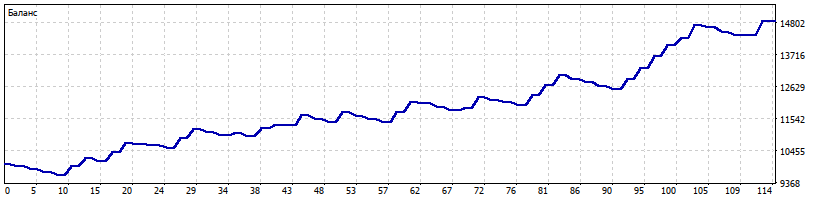
- Over the full 72 months the optimized set delivered +$4,857 on $10,000, profit factor 2.68, drawdown of up to 5.1% and 57 trades, about 10 a year. The classic, over the same months: +$3,462 with a 15.2% drawdown.
- 126 of 138 sets that were profitable in training stayed positive in the forward test. It isn’t a lucky number: it’s a property of the market.
- Costs play in the robot’s favor. Before swaps and commissions it earned $4,585, and the swaps on USDJPY buys added $341. The classic with sells, on the contrary, left $1,632 in swaps.
The risks, without makeup
- It’s a one-direction bet. The set only buys the dollar against the yen. If USDJPY enters a long decline, the robot will sit idle or accumulate stops.
- The swap can change. Part of the edge is the positive swap on buys. If rates change, the result changes.
- Few trades. In the forward test, 18 trades in two years. One or two months without a signal is normal, and a single streak of stops changes the picture noticeably.
- It doesn’t work on other markets. This set was only tested on USDJPY D1. The classic lost money on EURUSD, gold and oil.
Where to run the robot
The robot works on MetaTrader 5 with any broker that has USDJPY. My test was done on FxPro. The other brokers in my ranking also work: RoboForex and Tickmill. Before launching it, check the swap on USDJPY buys with your broker: in this test it played in my favor.
Download the “Triple Screen” robot for free
The robot is free for clients of the brokers in my ranking:
- Open a MetaTrader 5 account with one of the brokers above (or use the one you already have).
- Go to the Telegram bot with the button and send your account number.
- After verification, the bot sends you the file: the robot, Elder’s classic parameters and the ones optimized for USDJPY D1, plus the instructions.
📊 Download the free robot on Telegram
My conclusion
The Triple Screen is sold as a system that filters out bad trades with three filters. The test shows something else: three filters don’t protect you from a 38% drawdown, from swaps, or from the market changing. On USDJPY the classic honestly won for four years and almost stopped working as soon as the optimizer looked the other way.
What made it work wasn’t a fourth condition, but removing what was superfluous: eliminating the sells against the trend and against the swap, and letting the winner run to three stops. The result is a system that passed the forward test better than training, along with 126 of 138 neighboring sets. If you optimize the robot consistently, you can keep it in shape: the optimized .set shows what result that approach gives.
Today I also published the analysis of Parabolic SAR + Wilder’s ADX, where the complete opposite happens: the classic with no adjustments beat the optimization. Other analyses: the inside bar breakout, MACD + EMA 200 and the Turtles.
Why 72 months?
The market changes fundamentally every 3–5 years: participants and volatility change, and trends give way to ranges. On USDJPY you can see it without a magnifying glass. From late 2020 to mid-2024 the dollar rose more than 50% against the yen: the classic Triple Screen caught that trend and won. Over the last two years the pair has moved in wide swings, and the same system doesn’t advance. A 10–20 year test would mix those markets into an average figure that says nothing about what works today. The market changed: the strategy changes.
For the current market I look for strategies in my app “Find your strategy”, in the browser or on Telegram. Any idea can be tested there on a history of up to 72 months, and every 2 weeks the app automatically runs tens of thousands of strategies and shows you the ones that work over the last 6, 12 and 36 months. It doesn’t promise profits: it shows you what works now and what stayed in the previous cycle.
Backtest results do not guarantee future results.
Sources
- Alexander Elder — “Trading for a Living”, 1993 (in Spanish, “Vivir del trading”): the Triple Screen system, the Force Index and the 2% rule.
- Alexander Elder — “Come Into My Trading Room”, 2002.
- My own tests in MetaTrader 5 on the FxPro demo server, October 2026.
Where to trade
These are the brokers and exchanges I use and that work with clients from Latin America. Always check that the service is available in your country and start small.
Risk warning: CFDs, Forex and crypto derivatives carry a high risk of losing money due to leverage. This article is not investment advice.