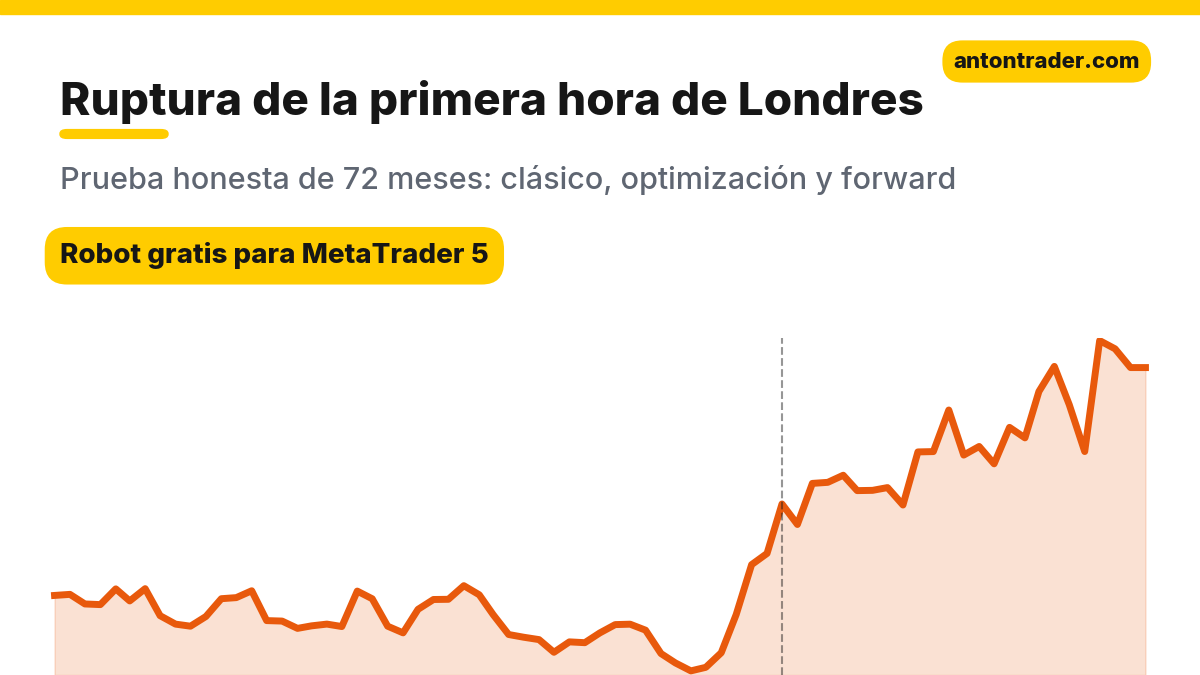
The first-hour breakout is one of the most popular intraday strategies in Forex. London opens, you mark the high and low of the first hour, wait to see which way the price leaves that box, and follow it. In the videos it looks like ready-made profit: one entry a day, a clear stop, and the position closed by evening. I coded a robot for MetaTrader 5 with the rules to the letter and ran it on seven markets over 72 months on 15-minute candles. I’ll tell you right from the start: this did not produce a tradable robot. In six of seven markets, losses with drawdowns of 73–94%. The only positive result is in USDJPY, and that very positive result shows why it is dangerous to trust it. I explain it in detail so you don’t have to pay for this lesson with your deposit.
The strategy rules
The idea of trading from the opening range was systematized by Toby Crabel in his book “Day Trading with Short Term Price Patterns and Opening Range Breakout” (1990). In Forex it is applied mostly to the London open, the main session of the currency market. The classic version:
- Range: the high and low of the first London hour, from 08:00 to 09:00 London time (10:00 to 11:00 on the FxPro server time).
- Buy: price breaks above the high of the range. Sell: below the low. Entry is immediate, on the breakout. One trade per day, on the first breakout.
- Stop: beyond the opposite edge of the range. No take profit.
- Exit by time, in the evening of the same day (22:00 server time). New entries only until 16:00. No positions are left open overnight.
- Position size is calculated to risk 1% of the balance up to the stop. M15 timeframe.
In spirit it is the little brother of the inside bar breakout: price compresses into a narrow range and we bet that the exit will bring movement.
What it looks like on the chart
Below are two real trades from the robot on USDJPY M15, the only market where the strategy ended up positive. They come from the best variant of the optimization: a range of an hour and a half (10:00–11:30 server time) and an exit at 18:00. Both are from the forward period, which the optimizer did not see.
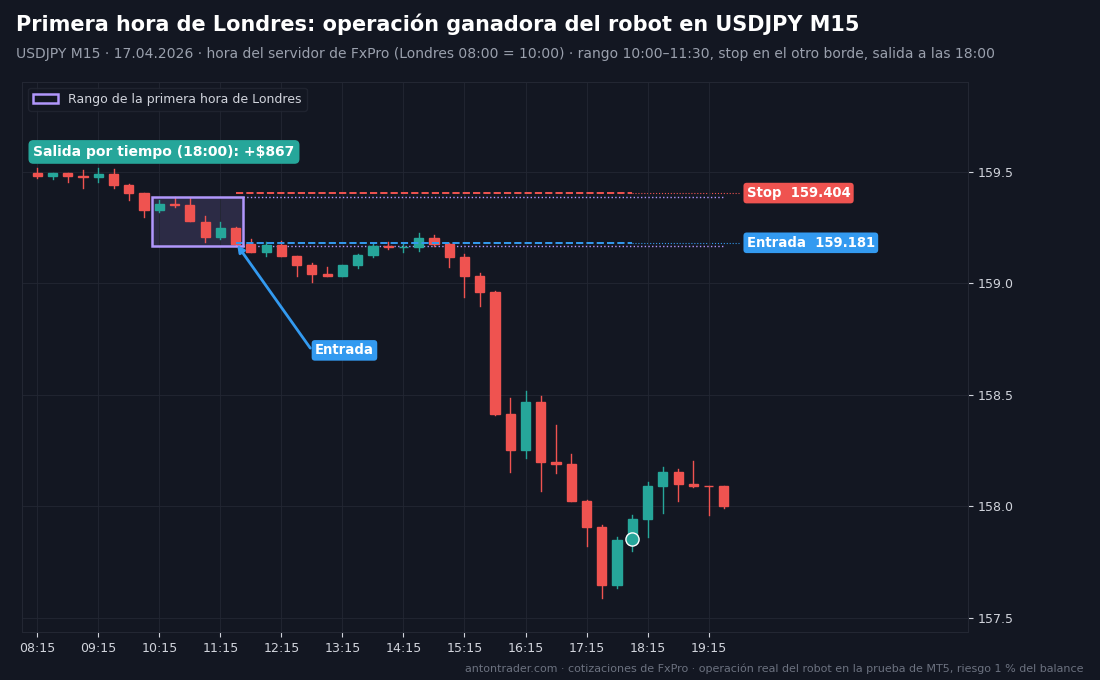
Winning trade. On April 17, 2026 the 10:00 to 11:30 range was narrow: from 159.186 to 159.404, about 22 pips. At 11:42 price broke downward and the robot sold at 159.181, with the stop at the upper edge, 159.404. During the day the pair accelerated its fall and by the afternoon it had already traveled more than a yen and a half. At 18:00 the robot closed the trade at 157.853: +$867, almost six stops in a single day.
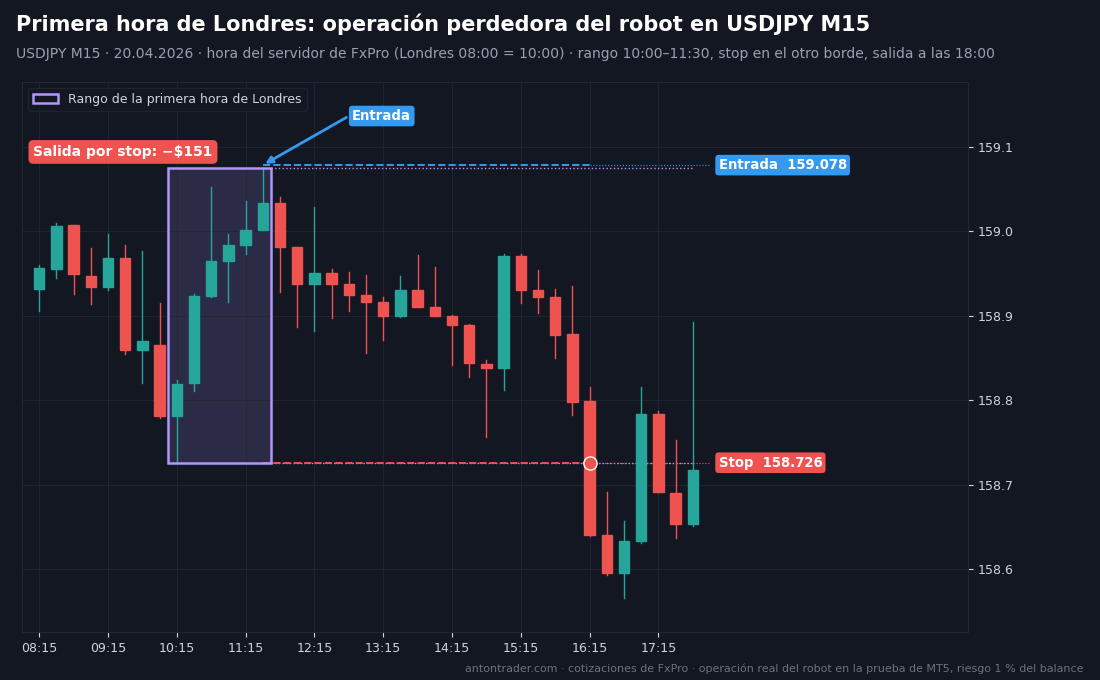
Losing trade. On April 20 the range was wider: from 158.726 to 159.052. At 11:36 price broke upward and the robot bought at 159.078, with the stop at the lower edge, 158.726. But the breakout was false: price went back into the box, crossed it entirely, and at 16:23 the stop was hit, −$151. Most days with this strategy look like this: winning trades are fewer than half.
Manually: on the M15 chart, mark the high and low of the first hour and a half after the London open (on FxPro that is 10:00–11:30 server time; with your broker the time may be different). Place a Buy Stop above the high and a Sell Stop below the low, with the stop at the opposite edge. When one order is triggered, delete the other. At 18:00 server time, close the trade wherever price is.
How I ran the test
- MetaTrader 5 Strategy Tester, FxPro demo server: the broker’s real quotes, spreads, commissions and swaps.
- Period from October 2020 to September 2026, exactly 72 months. Deposit of $10,000, leverage 1:100, risk of 1% per trade.
- “1 minute OHLC” mode: in an intraday breakout, what matters is the minute in which price crossed the edge.
Why 72 months and not 10 or 20 years, I explain at the end: the old years describe a different market. Three blocks: the classic without adjustments → optimization only with 10/2020–09/2024 → verification on 10/2024–09/2026, months the optimizer did not see.
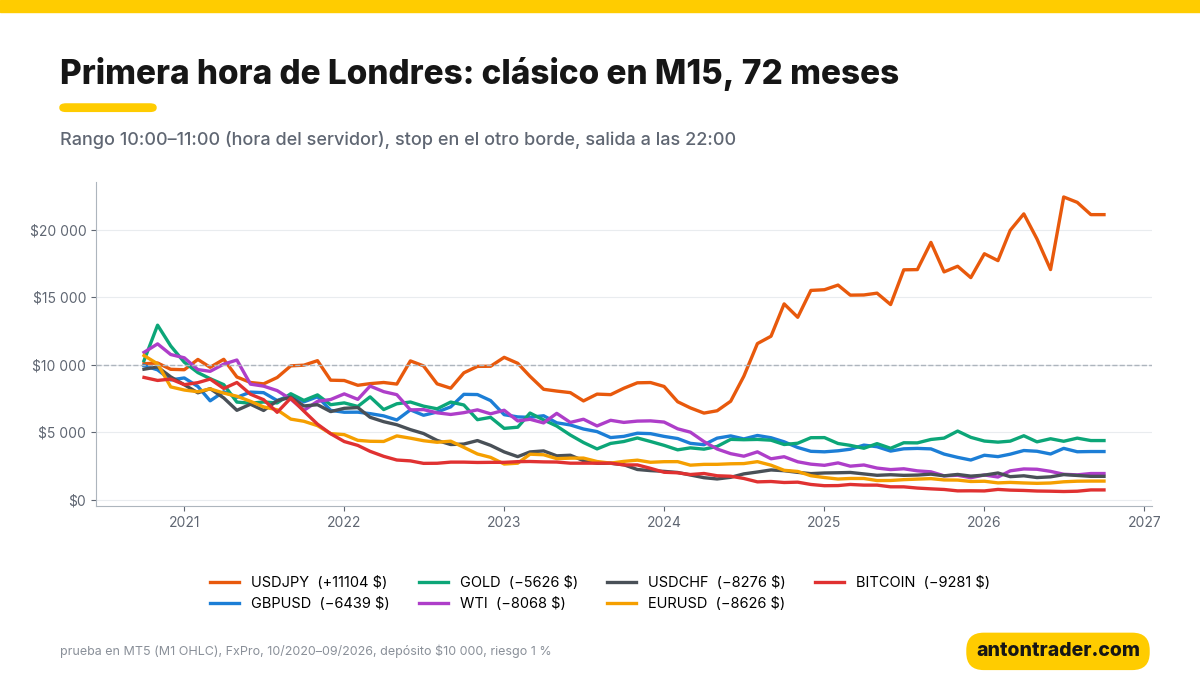
Block 1. The classic over 72 months: six losses out of seven
| Instrument (M15) | Result over 72 months | Profit factor | Max. drawdown | Trades | Winning trades |
|---|---|---|---|---|---|
| USDJPY | +$11,104 | 1.10 | 45.2% | 1,532 | 36% |
| GOLD | −$5,626 | 0.90 | 73.0% | 1,531 | 29% |
| GBPUSD | −$6,439 | 0.88 | 72.6% | 1,550 | 33% |
| WTI (oil) | −$8,068 | 0.86 | 87.2% | 1,536 | 26% |
| USDCHF | −$8,276 | 0.79 | 86.0% | 1,534 | 33% |
| EURUSD | −$8,626 | 0.76 | 89.7% | 1,537 | 33% |
| BITCOIN | −$9,281 | 0.68 | 94.4% | 1,309 | 25% |
About 250 trades a year, almost every business day. What stands out:
- Most breakouts are false. Only 25–36% of trades are winners. Price leaves the box, picks up the stops of those who entered, and comes back.
- Euro, franc, pound, oil and bitcoin: the deposit almost disappears, with drawdowns of 73–94%. This is not a “temporary drawdown”: it is a destroyed account.
- The costs are huge. One trade every day with a tight stop: commission and spread eat a visible part of the risk on every trade. Even in USDJPY the six years of commissions added up to $8,632.
- USDJPY ends up positive, but with a 45% drawdown. Almost half the deposit was lost along the way. Below I explain where that positive result comes from.
Block 2. Optimization with 10/2020–09/2024
I optimized on three markets: USDJPY, GOLD and GBPUSD (all on M15). I adjusted the range duration (30, 60 and 90 minutes), the exit time (18:00, 20:00, 22:00), the stop (the opposite edge or the middle of the range), the take profit from 0 to 2 stops, whether sells are allowed, and, for gold and the pound, also a filter: skipping days when the range is too wide relative to the daily ATR.
- GOLD M15: of 127 sets with 100+ trades, profitable in training: none.
- GBPUSD M15: of 131 sets: none.
- USDJPY M15: of 108 sets, 8 were profitable in training, and all 8 stayed positive in the forward. Sounds good, but all eight have a profit factor of 1.01–1.05 in training and drawdowns of 23–49%. That is not stability: it is a zero with big swings.
The best variant in the forward among those profitable in training has a longer range and an earlier exit:
| Parameter | Classic | Best variant (USDJPY M15) |
|---|---|---|
| Range | first hour: 10:00–11:00 server time | an hour and a half: 10:00–11:30 |
| Stop | opposite edge | opposite edge |
| Take profit | no | no |
| Time exit | 22:00 | 18:00 |
| Direction | buys and sells | buys and sells |
The optimizer barely changed anything, and that is an answer too. If a strategy can’t be improved in any of three markets, the problem isn’t in the settings but in the idea itself.
Block 3. Forward 10/2024–09/2026
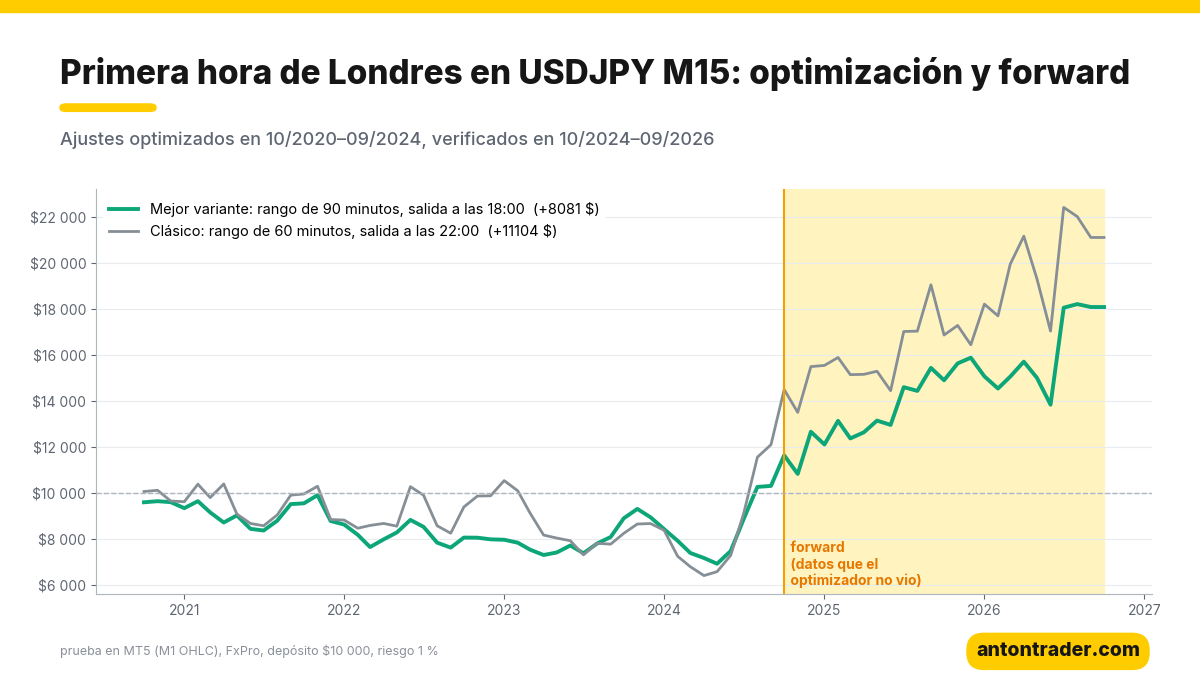
| Variant | Period | Result | Profit factor | Max. drawdown | Trades |
|---|---|---|---|---|---|
| Classic | 10/2020–09/2024 | +$2,098 | 1.04 | 45.2% | 1,026 |
| Best variant | 10/2020–09/2024 | +$306 | 1.01 | 36.6% | 1,013 |
| Classic | 10/2024–09/2026 (forward) | +$7,476 | 1.17 | 25.5% | 506 |
| Best variant | 10/2024–09/2026 (forward) | +$7,565 | 1.24 | 19.2% | 498 |
Each period was tested separately, starting with $10,000. The forward numbers look nice, but look at them calmly:
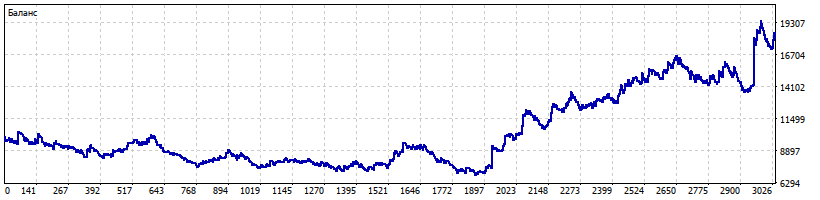
- Four years at zero. From October 2020 to September 2024 both versions went nowhere, with drawdowns of 37–45%. The whole result comes from the last two years.
- The profit depends on a few days. In the classic, 10 trades out of 1,532 gave 84% of all the profit before costs. A single trade on July 30, 2026, when the pair fell about 4 yen in a day, contributed +$4,505. Without those ten days, commissions would have eaten everything and the robot would have ended at a loss.
- The profit factor in the forward is 1.17–1.24. My threshold for a tradable robot is 1.3 or more with a reasonable drawdown. Here it is not reached in any market.
- Over the full 72 months the best variant gave +$8,081 with a drawdown of 36.6%; before costs it was $14,473, and commissions took $6,391, almost half.
This is not a robot I would recommend for a real account. It is a robot that shows what a strategy that lives off a few strong days in a single market looks like.
The risks, without makeup
- The strategy did not pass my check. In none of the seven markets is there a version with a profit factor of 1.3 or more in the forward and a reasonable drawdown.
- The positive result in USDJPY can disappear at any moment. It depends on a few days of strong yen moves. If those days don’t show up for a year, it will be a year of stops and commissions.
- It is psychologically very hard. Two thirds of trades are losers and the drawdown reached 45%. Few people can endure something like that manually without breaking the rules.
- Server time. If your broker has a different server time, you need to shift the “first hour” range; otherwise the robot will trade a completely different box.
Where to run the robot
If you want to research the strategy on your own, run it only in the tester or with minimum risk. The robot works in MetaTrader 5 with any broker. My test was done at FxPro. The other brokers in my ranking also work: RoboForex and Tickmill. For this strategy the main thing is a low commission and a tight spread on USDJPY: with one trade every day, they are almost everything.
Download the “London First Hour” robot for free
The robot is free for clients of the brokers in my ranking, for research and for your own tests:
- Open a MetaTrader 5 account with one of the brokers above (or use the one you already have).
- Go to the Telegram bot with the button and send your account number.
- After verification, the bot sends you the file: the robot, the classic parameters, the USDJPY M15 variant from the optimization, and the instructions with honest warnings.
📊 Download the robot for free on Telegram
My conclusion
The first-hour breakout is a nice idea that did not pass an honest check in any of seven markets. In six it destroys the deposit, and in the seventh it lives off a few good days and spends four years going nowhere. When someone shows you this strategy on a lucky chart, remember what was left out of the frame: hundreds of false breakouts and thousands of dollars in commissions.
A negative result is also a result. It saves money for whoever was thinking of trying this idea on a real account. If you really want to trade a range breakout, look at longer timeframes: in today’s analysis of the Larry Williams volatility breakout, the same logic on daily candles and buys only passed the forward test on USDJPY. Other analyses: the Keltner channel, the inside bar breakout and Parabolic SAR + ADX.
Why 72 months?
The market changes fundamentally every 3–5 years: the participants and the volatility change, and trends give way to ranges. Within the day this is especially clear. For four years, from 2020 to 2024, morning breakouts on USDJPY gave nothing. Then the yen started to have sharp intraday moves, and the same box suddenly started making money. A 10–20 year test would have blended all those regimes into a single figure and would tell you nothing about whether the strategy works now. You have to choose a strategy for the current market, and change it when the market changes.
That is why I built my app “Find your strategy”, in the browser or on Telegram. There you can test any idea on a history of up to 72 months, and every 2 weeks the app runs tens of thousands of strategies on its own and shows you the ones that work over the last 6, 12 and 36 months. It doesn’t promise profits: it helps you discard ideas like this one before they take your money.
Backtest results do not guarantee future results.
Sources
- Toby Crabel — “Day Trading with Short Term Price Patterns and Opening Range Breakout”, 1990: trading from the opening range.
- Own tests in MetaTrader 5 on the FxPro demo server, October 2026.
Where to trade
These are the brokers and exchanges I use and that work with clients from Latin America. Always check that the service is available in your country and start small.
Risk warning: CFDs, Forex and crypto derivatives carry a high risk of losing money due to leverage. This article is not investment advice.