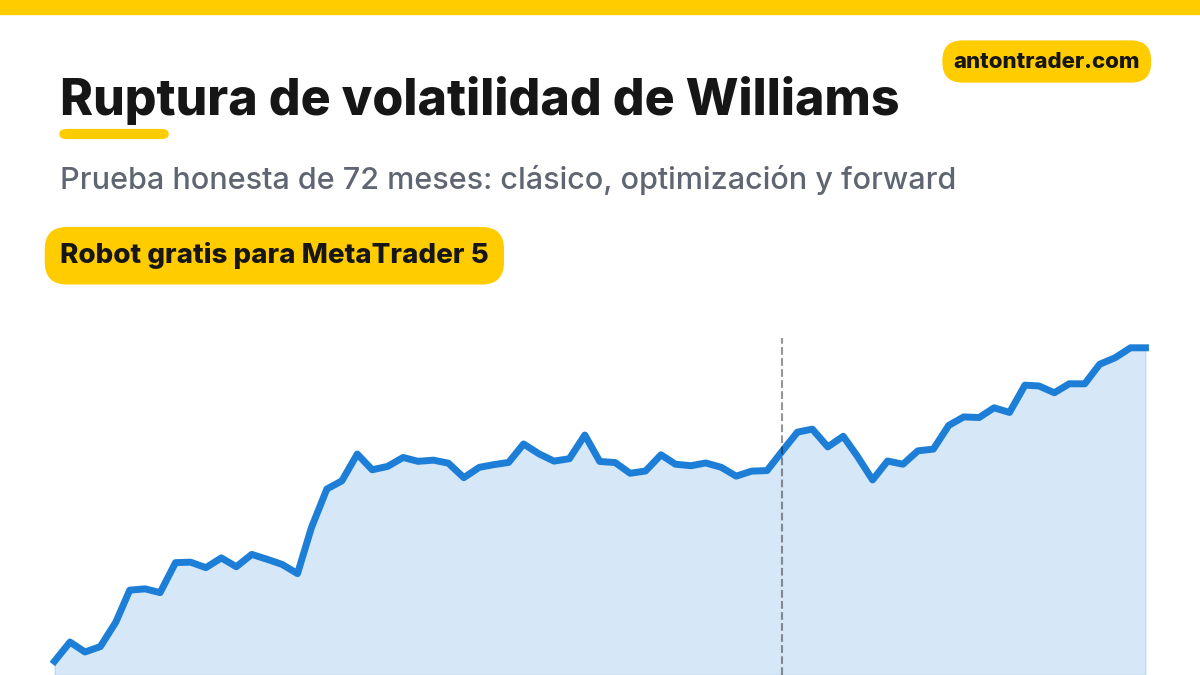
Larry Williams is one of the few authors who tested his ideas with his own money: in 1987 he won the World Cup Championship of Futures Trading with a return of more than 11,000% in a year. One of his best-known ideas is the volatility breakout: if from the day’s open the price has already covered a notable part of yesterday’s range, the move will most likely continue. The idea is neat and simple, which is why it is often resold as the “champion’s formula.” I coded a MetaTrader 5 robot with his rules to the letter and ran it on seven markets for 72 months. The classic lost on all of them: from −$3,311 to −$7,555 on a $10,000 deposit. But one version held up under a test on out-of-sample data: long-only on USDJPY, with an entry level set further away. I’ll show you the numbers, example trades and the robot, with its risks in plain view.
The strategy rules
Williams described the volatility breakout in his book “Long-Term Secrets to Short-Term Trading” (1999). Here is how it works in the robot:
- Daily levels: today’s opening price plus and minus a fraction of yesterday’s range (high − low of yesterday’s candle). In the classic, half the range.
- Buy: price rises to the upper level. Sell: it falls to the lower level. Entry is immediate, intraday, without waiting for the candle to close. No more than one trade per day.
- Stop: at a distance of one yesterday’s range from the entry.
- Exit: the “first profitable open,” Williams’ signature exit: if at the next day’s open the trade is in positive territory, it is closed. If it is in negative territory, the robot holds it until the first profitable open or until the stop.
- Position size is calculated to risk 1% of the balance down to the stop. D1 timeframe.
At heart it is a relative of the Turtles and the Keltner channel: buying strength. The difference is that Williams doesn’t measure strength with past highs, but with how far the price moved away from the open in a single day.
What it looks like on the chart
Below are two real trades from the robot, from the USDJPY D1 test. They come from the optimized variant: level = open + 0.9 of yesterday’s range, long-only, a one-range stop and a take profit of two stops. Both are from the forward period, which the optimizer did not see, and they are five days apart.
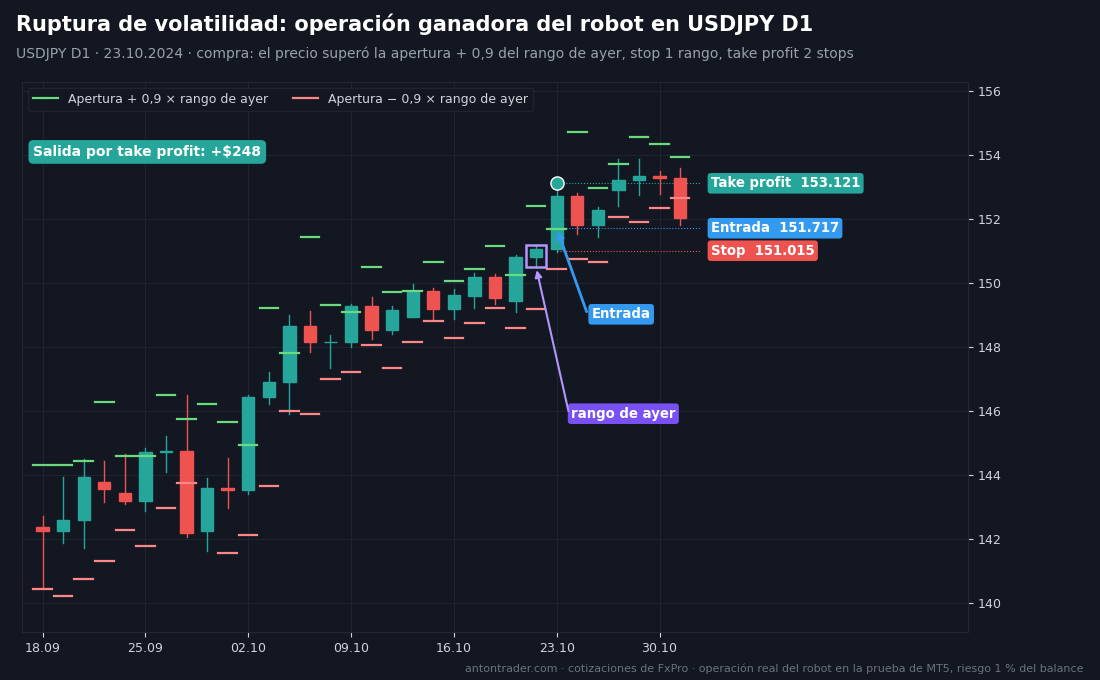
Winning trade. On October 22, 2024, the USDJPY range was 0.702 yen (from 150.494 to 151.196). On October 23 the day opened at 151.064, so the buy level was 151.064 + 0.9 × 0.702 ≈ 151.70. During the Asian session the price broke through it and the robot bought at 151.717. Stop at 151.015, take profit at 153.121. That same day the pair rose to 153.19 and the target was hit: +$248.
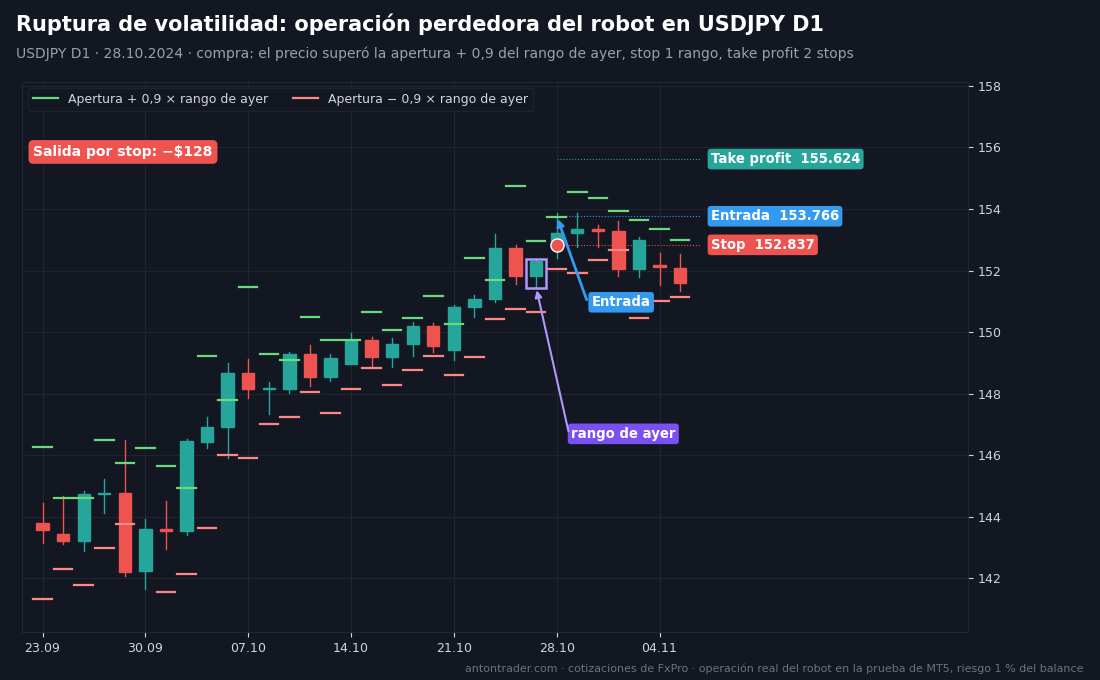
Losing trade. On Monday, October 28, the pair opened with an upward gap at 152.902. Friday’s range was 0.929, so the buy level was near 153.74. The robot bought at 153.766, with a stop at 152.837 and a take profit at 155.624. The rise ended there: during the day the price reversed and hit the stop, −$128. That’s how any breakout works: some of the signals are traps, and the system pays for them with a stop so as not to miss the real moves.
Manually: open the USDJPY daily chart, take yesterday’s candle and calculate its range, high minus low. Multiply it by 0.9 and add it to today’s opening price: that is the buy level, where you can place a Buy Stop pending order. The stop goes one yesterday’s range below the entry, and the take profit at twice that distance. If at the next day’s open the trade is in positive territory, close it.
How I ran the test
- MetaTrader 5 Strategy Tester, FxPro demo server: the broker’s real quotes, spreads, commissions and swaps.
- Period from October 2020 to September 2026, exactly 72 months. $10,000 deposit, 1:100 leverage, 1% risk per trade.
- “1 minute OHLC” mode: for an intraday entry this matters, because the tester sees the exact moment the price reached the level.
I’ll explain at the end why 72 months and not 10 or 20 years: old years describe a different market. Three blocks: the unadjusted classic → optimization using only 10/2020–09/2024 → verification on 10/2024–09/2026, months the optimizer did not see.
Block 1. The classic over 72 months: seven negatives out of seven
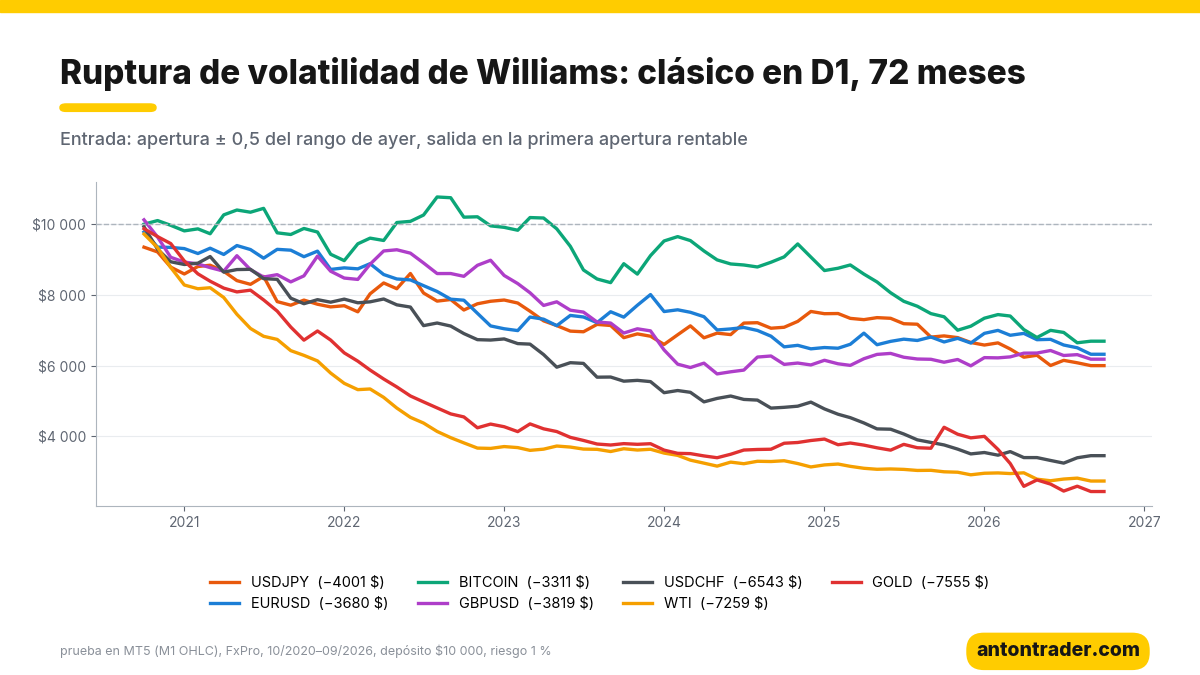
| Instrument (D1) | Result over 72 months | Profit factor | Max drawdown | Winning trades | Swaps |
|---|---|---|---|---|---|
| BITCOIN | −$3,311 | 0.90 | 42.8% | 58% | −$1,943 |
| EURUSD | −$3,680 | 0.84 | 37.0% | 63% | −$689 |
| GBPUSD | −$3,819 | 0.82 | 44.5% | 64% | −$501 |
| USDJPY | −$4,001 | 0.82 | 41.0% | 61% | −$1,040 |
| USDCHF | −$6,543 | 0.64 | 68.0% | 58% | −$538 |
| WTI (oil) | −$7,259 | 0.47 | 73.4% | 52% | −$742 |
| GOLD | −$7,555 | 0.58 | 76.8% | 53% | −$652 |
Between 693 and 1,061 trades per market, roughly 115–175 per year. What stands out:
- More than half the trades are winners, and there is still a loss. It’s a classic trap: the “first profitable open” takes a small gain, while the loss runs all the way to the full stop. A high win rate is reassuring, but your deposit doesn’t count percentages, it counts dollars.
- Half the range is noise. The price covers that distance from the open almost every day, and often in both directions. The robot enters and the move doesn’t continue.
- Gold and oil are the most painful: drawdowns of 73–77%. If someone sells you the volatility breakout on gold as a “simple system,” this is the price of that simplicity.
- Costs finish the job. On USDJPY the classic paid $1,040 in swaps and $709 in commissions: almost half of the loss.
Block 2. Optimization on 10/2020–09/2024
I optimized on USDJPY D1 and BITCOIN D1, the two with the highest profit factor in the classic. I tuned the fraction of the range for entry (0.2–1.0), the stop (0.5–2 ranges), the take profit (0–3 stops), the exit mode (at the next open or at the first profitable open) and whether shorts are allowed.
- BITCOIN D1: of the sets with 60+ trades, 10 were profitable in training. None stayed positive in the forward test. In the classic, bitcoin looked like the best, but it was an illusion.
- USDJPY D1: 53 profitable sets in training, and 48 of them stayed positive in the forward test. All the best sets are long-only.
I chose a set with a good forward result and profitable neighbors (level of 0.8–1.0 of the range, stop of 1–1.5 ranges):
| Parameter | Williams classic | Optimization (USDJPY D1) |
|---|---|---|
| Entry level | open ± 0.5 of the range | open + 0.9 of the range |
| Direction | longs and shorts | long-only |
| Stop | 1 yesterday’s range | 1 yesterday’s range |
| Take profit | none | 2 stops |
| Exit | first profitable open | first profitable open |
In essence, the optimizer said: half the range is a normal day, not a signal. Enter only when the day is truly strong, and only in the direction the pair is heading.
Block 3. Forward 10/2024–09/2026
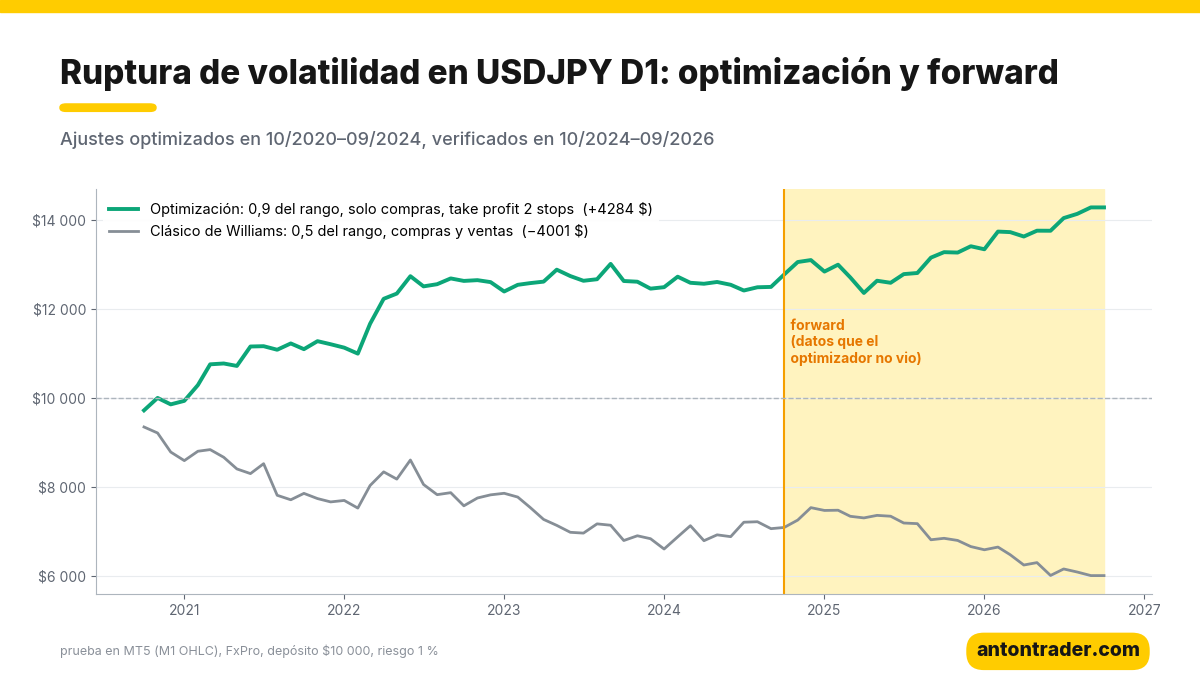
| Variant | Period | Result | Profit factor | Max drawdown | Trades |
|---|---|---|---|---|---|
| Classic | 10/2020–09/2024 | −$2,945 | 0.81 | 35.4% | 544 |
| Optimization | 10/2020–09/2024 | +$2,495 | 1.32 | 5.5% | 202 |
| Classic | 10/2024–09/2026 (forward) | −$1,537 | 0.84 | 22.8% | 274 |
| Optimization | 10/2024–09/2026 (forward) | +$1,420 | 1.56 | 6.4% | 91 |
Each period was tested separately, starting with $10,000. The result:
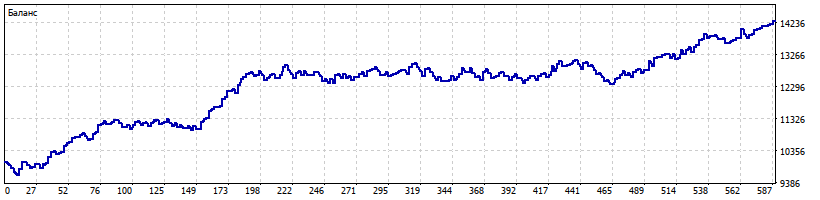
- The optimization passed the forward test: +$1,420, profit factor 1.56, drawdown of 6.4%, on data the optimizer did not see. Per year it gives roughly the same as in training: a good sign that the set is not overfitted.
- The classic on USDJPY kept losing in the forward test too: −$1,537 with a drawdown of 22.8%.
- Over the full 72 months: +$4,284 on $10,000, drawdown of up to 6.5%, 293 trades, 70% winners. Before costs, $4,241; commissions took $530 and swaps, on the contrary, added $573: on USDJPY longs the swap at FxPro is positive.
- But, to be honest: in almost all of these years the dollar strengthened against the yen, from 105 in October 2020 to almost 162 in the summer of 2024. A long-only robot in a market like that doesn’t “guess” anything: it simply stays out of its own way to make money from it.
If you re-optimize the robot regularly, you can keep it in shape: the optimized .set shows what result this approach gives on USDJPY.
The risks, with no makeup
- The robot only buys USDJPY. If the yen starts to appreciate strongly, it will pile up stops. An example: July–August 2024, when in one month the pair fell from 161.95 to 141.68.
- Japanese interventions. Japan’s Ministry of Finance has stepped into the market more than once to support the yen. On those days the price can jump over your stop with slippage, and the loss can be greater than 1%.
- Swaps can flip. The positive swap on longs depends on the interest rate differential between the United States and Japan. If that gap narrows, this bonus disappears too.
- A 70% win rate is no reason to raise your risk. The gain is often taken at the first open, and the loss runs to the full stop. A streak of three or four stops in a row is normal in this system.
Where to run the robot
The robot works in MetaTrader 5 with any broker that offers USDJPY. My test was done at FxPro. The other brokers in my ranking also work: RoboForex and Tickmill. Before launching it, check the swap on USDJPY longs with your broker: in this test it worked in favor of the result, and with another broker it may be lower.
Download the “Volatility Breakout” robot for free
The robot is free for clients of the brokers in my ranking:
- Open a MetaTrader 5 account with one of the brokers above (or use the one you already have).
- Go to the Telegram bot with the button and send your account number.
- After verification, the bot sends you the file: the robot, Williams’ classic parameters, the ones optimized for USDJPY D1 and the instructions.
📊 Download the robot for free on Telegram
My conclusion
The volatility breakout in its classic form is a good example of how a champion’s rule turns into a loss when you carry it over to another market and another decade. Half of yesterday’s range, in the 2020s, is not strength: it’s normal noise, and seven markets out of seven confirmed it. Here the high win rate only disguises the problem. If someone shows you this strategy as a sure-fire formula, protect your deposit and ask to see the full test.
The living version appeared when I kept the essence of Williams, entry on the strength of the day and exit at the first profitable open, and added two conditions: the day has to be truly strong and the trade goes only in the direction of the pair. It’s a robot for one specific market, USDJPY, not a universal formula. It behaved well in the forward test, but it has to be watched with the same attention as the yen itself.
Today I also published the analysis of the London first-hour breakout: the same breakout idea, but intraday. There the robot only won on USDJPY and only thanks to a few strong days; it did not pass the check, and that is also a useful result. On long-only USDJPY D1, Elder’s Triple Screen also survived earlier. Other analyses: Ichimoku, Parabolic SAR + ADX and the inside bar breakout.
Why 72 months?
The market changes fundamentally every 3–5 years: the participants and the volatility change, and trends give way to ranges. In these six years USDJPY went through two different markets. Until mid-2024, an almost continuous rise driven by the interest rate differential, where buying the day’s strength worked on its own. After that, the sharp drop of summer 2024, interventions and wide swings between 140 and 164. A 10–20-year test would have mixed those phases with a yen very different from the 2010s and would give you an average that describes no real market. A strategy should be chosen for the current market, and changed when the market changes.
That’s why I built my app “Find your strategy” (Encuentra tu estrategia), in the browser or on Telegram. There you can test any idea on a history of up to 72 months, and every 2 weeks the app runs tens of thousands of strategies on its own and shows you the ones that work over the last 6, 12 and 36 months. It doesn’t promise profits: it shows you which ideas are still alive in the market that exists today.
Backtest results do not guarantee future results.
Sources
- Larry Williams — “Long-Term Secrets to Short-Term Trading,” 1999: the volatility breakout and the exit at the first profitable open.
- Own tests in MetaTrader 5 on the FxPro demo server, October 2026.
Where to trade
These are the brokers and exchanges I use that work with clients from Latin America. Always check that the service is available in your country and start small.
Risk warning: CFDs, Forex and crypto derivatives carry a high risk of losing money due to leverage. This article is not investment advice.