The “golden cross” is the most repeated signal in trading. The 50-day moving average crosses above the 200-day moving average, and the financial news channels announce in unison “the start of a bull market.” It crosses down: “death cross,” time to run for the exits. It’s a simple, pretty rule that everybody knows. That’s exactly why it’s worth putting to the test. I programmed a robot for MetaTrader 5, ran the “golden cross” over 10 years of history on seven instruments, and got zero profitable results. Then I found where the moving average crossover does work, and it’s not where everyone looks. All the numbers are below; the robot is at the end of the article.
The rules of the “golden cross”
The classic description is in John Murphy, “Technical Analysis of the Financial Markets”: the crossover of the 50-day and 200-day moving averages is one of the most popular long-term signals. I took it as is, with no embellishments:
- Buy. The SMA 50 closes above the SMA 200 (“golden cross”).
- Sell. The SMA 50 closes below the SMA 200 (“death cross”). The long is closed and a short is opened.
- Always in the market. The system reverses with every cross. The original has no stop loss: the exit is the opposite cross.
- D1 timeframe. The signal is checked once a day, at the close.
- Position size is calculated so that a 3 ATR move against you costs 1% of the account.
The idea: catch one big trend from start to finish and hold on to it. There are few trades, 1–2 per year per instrument. All the hope rests on a handful of huge moves.
How I ran the test
- MetaTrader 5, FxPro demo server, real spreads and swaps from the broker.
- Period from 2016 to October 2026, $10 000 deposit, 1:100 leverage, 1% risk.
- “1 minute OHLC” mode, not the fast “open prices only” mode, which models stops unrealistically.
Three blocks: the classic with no adjustments → optimization using only 2016–2022 → verification on 2023–2026, years the optimizer never saw. Indices like the S&P 500, where the “golden cross” is talked about the most, are not in my copy of the FxPro tester, so I tested it on forex, gold, oil and Bitcoin.
Block 1. The classic: seven instruments, seven losses
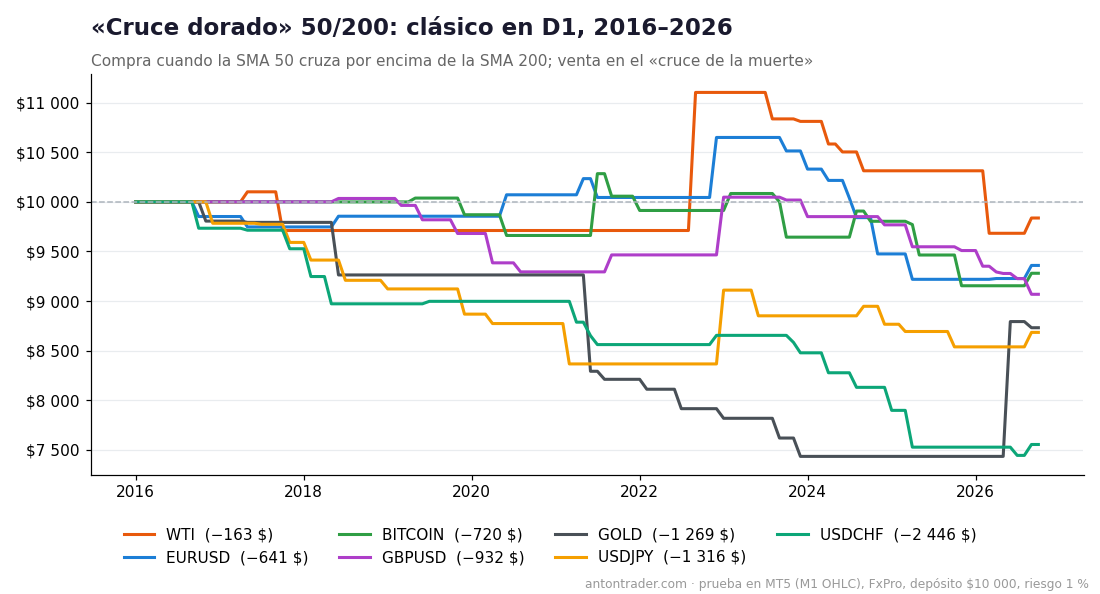
| Instrument (D1) | 10-year result | Profit factor | Max. drawdown | Trades | Swaps |
|---|---|---|---|---|---|
| WTI (oil) | −$163 | 0.91 | 18.8% | 11 | −$446 |
| EURUSD | −$641 | 0.66 | 18.3% | 18 | −$400 |
| BITCOIN | −$720 | 0.63 | 27.8% | 16 | −$1 737 |
| GBPUSD | −$932 | 0.46 | 16.4% | 19 | −$383 |
| GOLD | −$1 269 | 0.52 | 28.0% | 12 | −$1 012 |
| USDJPY | −$1 316 | 0.43 | 21.4% | 17 | −$931 |
| USDCHF | −$2 446 | 0.09 | 26.2% | 18 | −$810 |
Not a single positive one. Even where there were brutal trends over those 10 years. Why?
- The signal comes too late. The 200-day average is almost a year of history. By the time it turns, most of the move has already happened. The cross buys at the end of the rally and sells at the end of the decline.
- Ranges kill it with a thousand cuts. When the market moves sideways, the averages cross back and forth, and every reversal is another loss plus the spread.
- Swaps. The system holds positions for months. Look at gold: before costs the result was about −$255, and swaps added another −$1 012.
The clearest example is gold. Since 2016 it has more than tripled. The “golden cross” caught the rally from December 2023 to summer 2026 and made about $2 000 with it. But the earlier years ate it all: the 2018–2021 short alone, in a rising market, left a $1 533 loss. Result: negative. There was a trend, but there was no money.
Block 2. Optimization: gold can’t be saved, Bitcoin is another story
On D1 the cross has too few trades to optimize honestly, so I moved to H4. I tuned the periods of the fast and slow averages, the type of average (SMA or EMA), whether shorts are allowed, and an emergency stop in ATR. Optimization used only 2016–2022.
Gold H4: out of 152 parameter sets tested, only one was profitable in 2016–2022. Yes, in 2023–2026 almost everything made money, but not thanks to the system, rather because those were years in which gold rose non-stop. A system that loses for six years and then catches a rally is not something I consider a system that works.
Bitcoin H4 is the opposite picture. Out of 160 sets, 125 were profitable in the training period. That means that on Bitcoin the moving average crossover captures a real property of the market, not a lucky number.
Another finding: even the classic 50/200 rules with no adjustment at all, only on H4 instead of D1, gave +$23 347 on Bitcoin over the whole period and stayed positive in the forward test (+$1 666). The timeframe turned out to matter more than the parameters: on H4, 200 bars is about a month and the signal manages to follow the move.
I didn’t pick the most profitable set. I took one close to the classic whose neighbors are also positive:
| Parameter | Classic | Optimization (BITCOIN H4) |
|---|---|---|
| Fast average | SMA 50 | EMA 60 |
| Slow average | SMA 200 | EMA 200 |
| Timeframe | D1 | H4 |
| Direction | buys and sells | buys only |
| Stop | none | 4 ATR |
Block 3. Forward 2023–2026
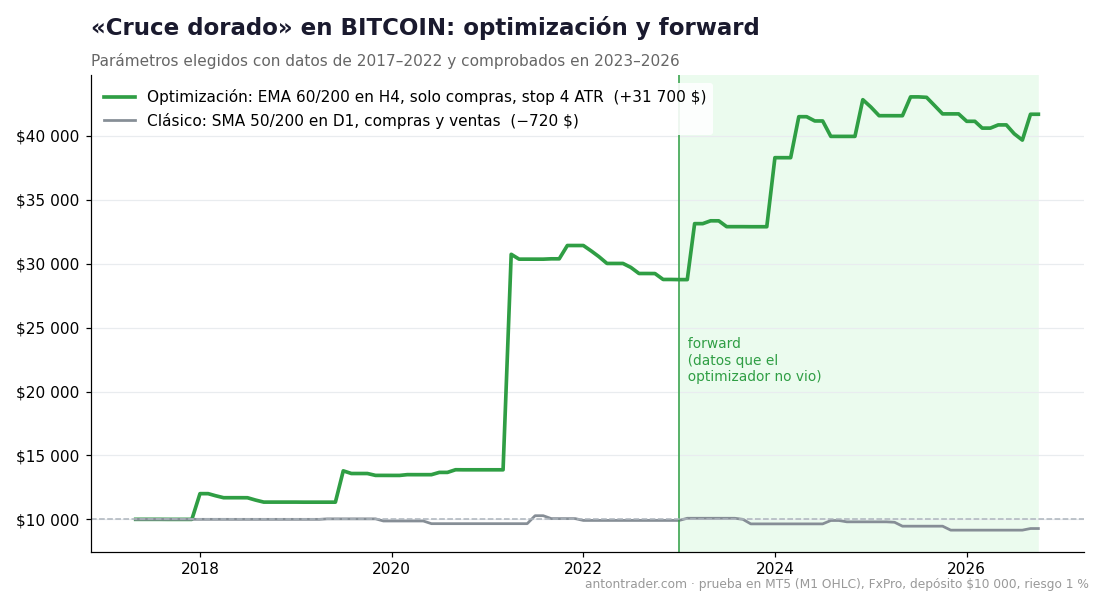
| Variant | Period | Result | Profit factor | Max. drawdown | Trades |
|---|---|---|---|---|---|
| Classic (D1) | 2017–2022 | +$154 | 1.21 | 21.7% | 7 |
| Optimization (H4) | 2017–2022 | +$18 771 | 5.60 | 30.2% | 21 |
| Classic (D1) | 2023–2026 (forward) | −$805 | 0.33 | 12.2% | 9 |
| Optimization (H4) | 2023–2026 (forward) | +$4 544 | 3.07 | 13.7% | 21 |
Each period was tested separately, starting with $10 000. The BITCOIN history at FxPro starts in May 2017. What you see:
- In the forward test, the optimized variant won and the classic lost. Profit factor of 3.07 on data the optimizer never saw.
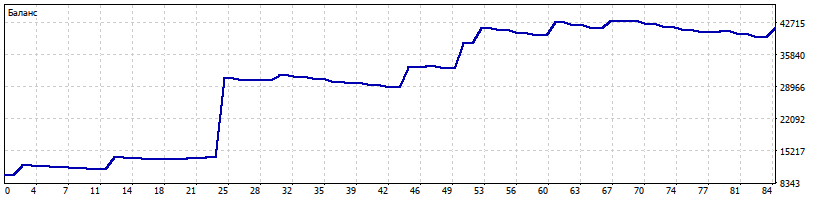
- The profit comes from a few big trends. Only 38% of trades are winners, and the big jump in the curve came with the 2020–2021 bull market.
- Swaps. Over the whole period, the optimized variant made $45 078 before costs and left $13 278 to the broker in swaps: almost a third.
Of the 125 sets that were profitable in the training period, 115 stayed positive in the forward test. It’s the best stability indicator of all the strategies I’ve tested so far.
The risks, without makeup
- Drawdown of up to 30%. In the training period, the optimized variant fell 30%. A trend system spends a lot of time idle or losing, and then makes the year with a single trade.
- Few trades. About four a year. If Bitcoin has no trend next year, a series of small losses will follow, and that’s normal for this system.
- Swaps decide. A third of the gross profit went to swaps. Crypto swaps vary enormously from one broker to another: compare them before you start.
- A single instrument. The whole part that works depends on Bitcoin. On forex and gold, the “golden cross” only lost in my tests.
If you optimize the robot periodically, for example once a year with the most recent years and always checking on a forward test, you can keep it in shape. The optimized .set in the file shows the result this approach gives.
Where to run the robot
The robot works in MetaTrader 5 with any broker that offers Bitcoin. My test was done at FxPro. The other brokers in my ranking also work: RoboForex and Tickmill. Check that the broker you choose offers cryptocurrencies on MT5 and how much it charges in swaps.
Download the “Golden Cross” robot for free
The robot is free for clients of the brokers in my ranking:
- Open a MetaTrader 5 account with one of the brokers above (or use the one you already have).
- Go to the Telegram bot with the button and send your account number.
- After verification, the bot sends you the file: the robot, the classic 50/200 parameters and the ones optimized for Bitcoin H4, plus instructions.
📈 Download the robot for free on Telegram
My conclusion
The “golden cross,” as the news channels sell it, is not a trading system: it’s a headline. On daily charts of forex, gold and oil it didn’t win anywhere in 10 years. A signal that everyone sees and that arrives months late cannot produce money consistently.
But the idea of the moving average crossover isn’t dead. On Bitcoin, where the trends are real, and on H4, where the signal doesn’t arrive late, it works and holds up under testing on new data. The difference isn’t in magic numbers, but in where and on what timeframe you apply it.
Other analyses: mean reversion with Bollinger Bands, a strategy with the opposite logic that also passed the forward test, but in a totally different market. The Dennis Turtles, just like the cross, are only still alive on Bitcoin, and the short system Connors’ RSI-2 works on the pound.
Backtest results do not guarantee future results.
Sources
- John J. Murphy — “Technical Analysis of the Financial Markets” (in Spanish, “Análisis técnico de los mercados financieros”), 1999: chapter on moving averages.
- My own tests in MetaTrader 5 on the FxPro demo server, October 2026.
Where to trade
These are the brokers and exchanges I use and that work with clients from Latin America. Always check that the service is available in your country and start small.
Risk warning: CFDs, Forex and crypto derivatives carry a high risk of losing money due to leverage. This article is not investment advice.