Ichimoku is perhaps the most “Japanese” indicator on the platform: five lines, a cloud, and shifts forward and backward. At first glance it looks like a complete system, almost a philosophy of the market. Goichi Hosoda refined it by hand over decades, without computers. I programmed a MetaTrader 5 robot with the classic rules to the letter and ran it on seven markets over 72 months. Half of the markets ended at a loss. The nice result on bitcoin, when you look at it closely, rests on a single trade from 2020. But what was left after an honest check with future data is indeed alive. I’ll show you the numbers, example trades, and the robot, so you can decide with data and not with promises.
The strategy rules
Ichimoku Kinko Hyo translates roughly as “equilibrium at a glance.” Its main lines:
- Tenkan-sen (9): the midpoint of the range of the last 9 days, (high + low) / 2. It’s the fast line.
- Kijun-sen (26): the same for 26 days. It’s the slow line, the “base.”
- The cloud (Kumo): the space between Senkou A ((Tenkan + Kijun) / 2) and Senkou B (midpoint of the 52-day range). Both lines are shifted 26 days forward.
The mechanical version of the classic signal that I tested:
- Buy: at the daily close, the Tenkan crosses the Kijun upward and the price closes above the cloud. This is the “strong” signal according to Hosoda.
- Sell: the opposite: the Tenkan crosses the Kijun downward and the price closes below the cloud.
- Exit on the reverse cross of Tenkan and Kijun. No take profit.
- Protective stop at 2 ATR(14) from the entry. Hosoda doesn’t set a numeric stop: this is my own assumption so I can measure risk.
- Position size is calculated to risk 1% of the balance up to the stop. D1 timeframe, buys and sells.
It’s a trend system, like Parabolic SAR + ADX and the “golden cross”: few trades, most of them losers, and the profit comes from a handful of long trends.
What it looks like on the chart
Below are two real trades from the robot, from the bitcoin D1 test. They come from the optimized variant (Tenkan 15 instead of 9, no cloud filter, exit when the day closes on the other side of the Kijun). The entry mechanics are the same: the cross of two lines. Both are from the forward period, which the optimizer did not see.
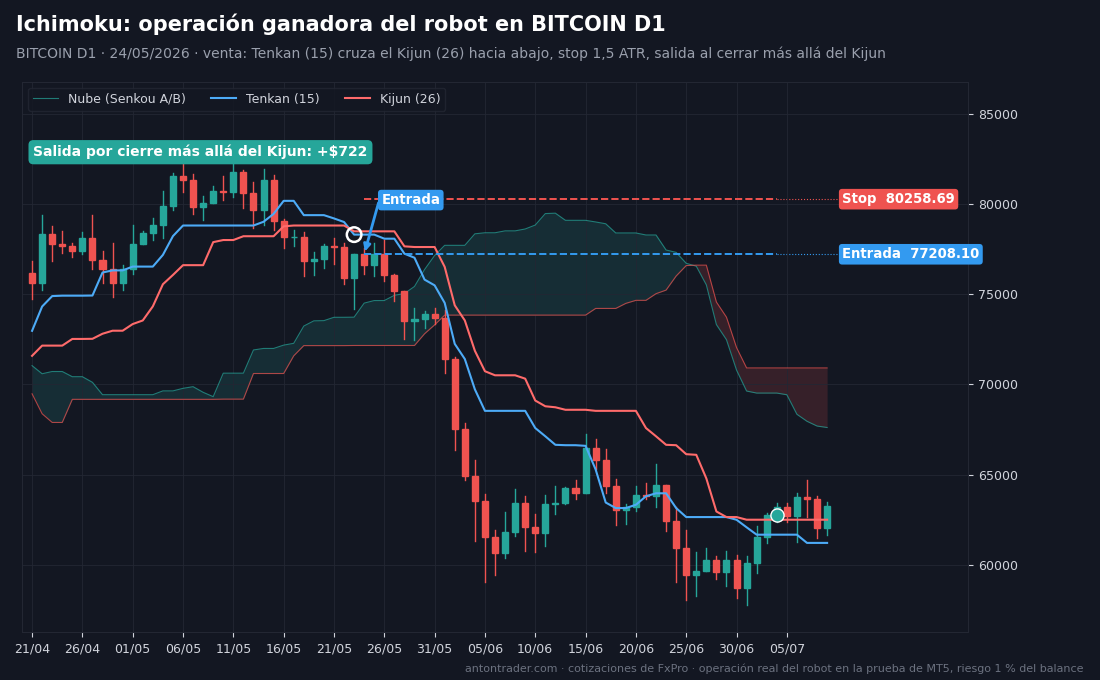
Winning trade. On May 23, 2026, at the daily close, the blue Tenkan crossed the red Kijun downward: bitcoin was starting to slide from $80,000. On May 24 the robot sold at 77,208.10. Stop 1.5 ATR higher, at 80,258.69. No take profit: the position is held until a daily candle closes above the Kijun. The decline lasted over a month and the Kijun kept dropping behind the price. On July 4 the candle closed above the line and the exit was at 62,766.78: +$722, more than seven times the risk in a single trade.
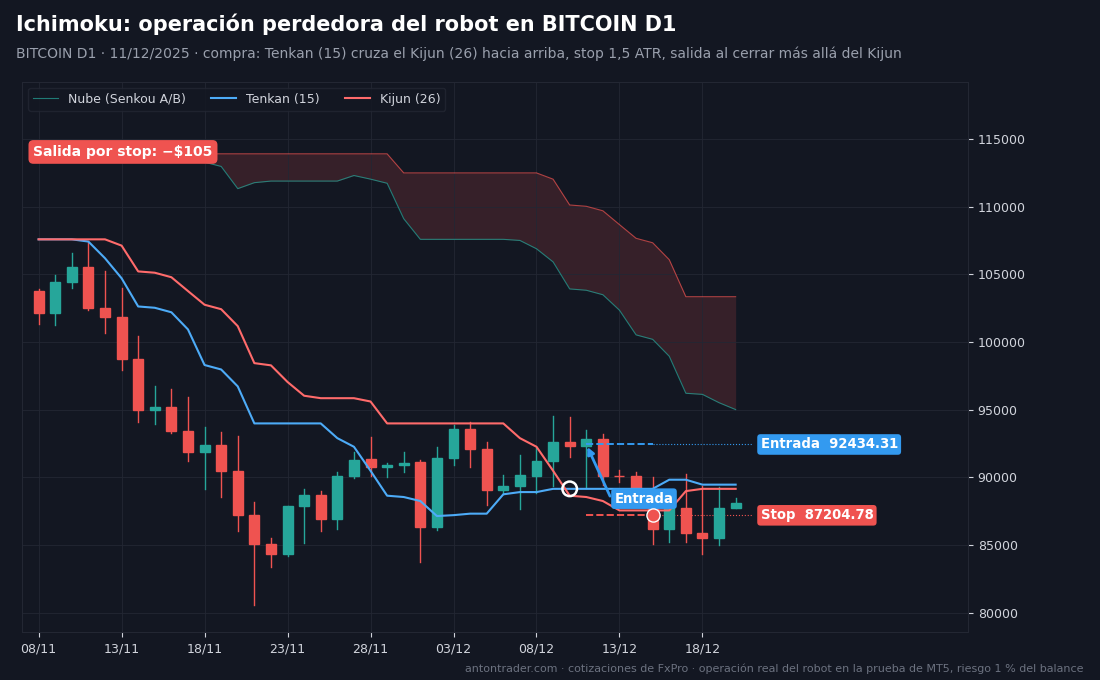
Losing trade. On December 10, 2025, after the drop that began in November, the Tenkan crossed the Kijun upward: formally, a “turn.” The cloud was still well above the price. For Hosoda’s classic Ichimoku this is a weak signal, but the optimized set has no cloud filter. On December 11, buy at 92,434.31, stop at 87,204.78. The rally never came: on December 15 the price hit the stop, −$105.
By hand it’s the same: on the daily chart, turn on the Ichimoku indicator (in MT5 it’s called “Ichimoku Kinko Hyo”). Wait for the day when the blue Tenkan crosses the red Kijun. In the classic version, buy only if the candle closed above the cloud and sell only if it closed below. Enter at the next day’s open, put the stop at 1.5–2 ATR, and exit on the reverse cross of the lines or when the day closes on the other side of the Kijun.
How I ran the test
- MetaTrader 5 Strategy Tester, FxPro demo server: the broker’s real quotes, spreads and swaps.
- Period from October 2020 to September 2026, exactly 72 months. $10,000 deposit, 1:100 leverage, 1% risk per trade.
- “1 minute OHLC” mode, the closest to reality among the fast tester modes.
I’ll explain at the end why 72 months and not 10 or 20 years: old years describe a different market. Three blocks: the classic with no adjustments → optimization only on 10/2020–09/2024 → verification on 10/2024–09/2026, months the optimizer did not see.
Block 1. The classic over 72 months: three positive, four negative
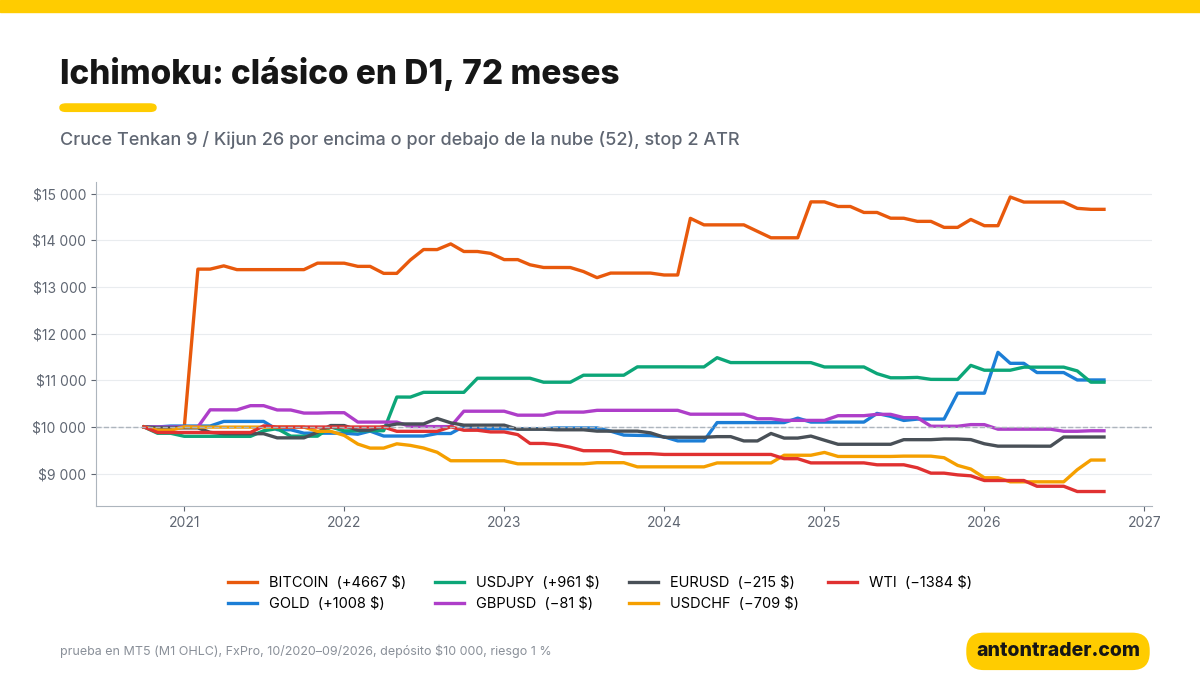
| Instrument (D1) | Result over 72 months | Profit factor | Max. drawdown | Winning trades | Swaps |
|---|---|---|---|---|---|
| BITCOIN | +$4,667 | 2.75 | 14.1% | 35% | −$1,072 |
| GOLD | +$1,008 | 1.60 | 9.9% | 38% | −$651 |
| USDJPY | +$961 | 1.66 | 6.2% | 45% | +$49 |
| GBPUSD | −$81 | 0.93 | 7.0% | 42% | −$161 |
| EURUSD | −$215 | 0.83 | 7.2% | 37% | −$137 |
| USDCHF | −$709 | 0.58 | 13.5% | 29% | −$424 |
| WTI (oil) | −$1,384 | 0.15 | 15.7% | 8% | −$760 |
Between 24 and 40 trades per market in six years: fewer than 7 per year. What stands out:
- Bitcoin leads, but with a caveat. Of the +$4,667, $3,710 came from a single trade: the October 2020 buy, at the start of a big bull market. Without it, the classic on bitcoin leaves about +$950 over six years.
- Gold and the yen end with a modest positive result: they are markets with long trends in recent years.
- Euro, pound and franc: zero or a loss. On the major pairs, Tenkan and Kijun crosses happen inside the range and gradually wear down the account.
- Oil is a failure: 2 winning trades out of 26. Ichimoku can’t keep up with oil’s sharp reversals.
Block 2. Optimization on 10/2020–09/2024
I optimized on BITCOIN D1 and USDJPY D1. I adjusted the Tenkan (5–15), Kijun (18–42) and Senkou B (40–76) periods, the cloud filter, the Chikou confirmation, the exit type, the stop from 1 to 4 ATR, the take profit, and whether sells are allowed.
- USDJPY D1: the overfitting trap. Of the sets with 15+ trades, 133 were profitable in training, and in the forward test only 18 stayed positive. The best training set (+$4,224) earned $146 in the forward test. This is exactly what “holy grail robots” sell: a perfect curve in the history and zero in the real market. That’s why I ask you never to buy a robot just for its curve.
- BITCOIN D1: more stable. 118 profitable sets in training, and of those 67 stayed positive in the forward test. More than half: on bitcoin the idea doesn’t work by chance.
For bitcoin I chose the set based on the forward test and its neighbors, not on maximum profit:
| Parameter | Hosoda’s classic | Optimization (BITCOIN D1) |
|---|---|---|
| Tenkan / Kijun / Senkou B | 9 / 26 / 52 | 15 / 26 / 52 |
| Cloud filter | yes | no |
| Exit | reverse Tenkan/Kijun cross | daily close on the other side of the Kijun |
| Stop | 2 ATR | 1.5 ATR |
| Take profit | no | no |
| Direction | buys and sells | buys and sells |
The main difference is in the exit. The classic waits for the reverse cross of the lines and gives a good part of the profit back to the market. The exit on the close on the other side of the Kijun comes earlier.
Block 3. Forward 10/2024–09/2026
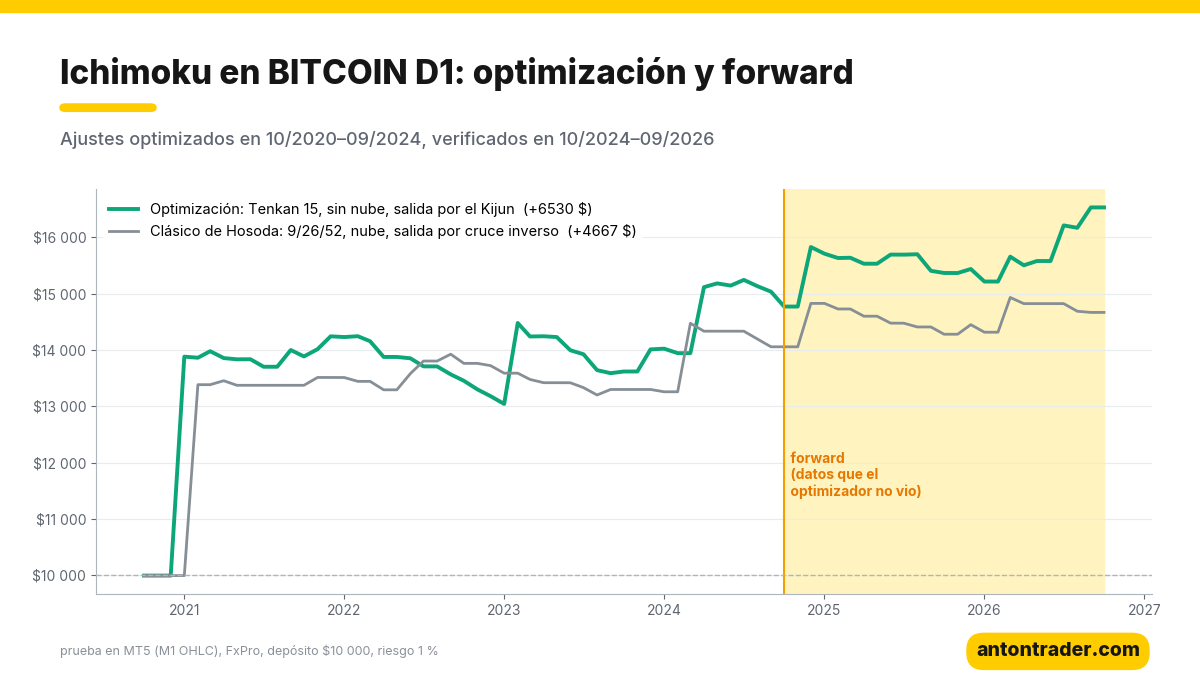
| Variant | Period | Result | Profit factor | Max. drawdown | Trades |
|---|---|---|---|---|---|
| Classic | 10/2020–09/2024 | +$4,057 | 3.56 | 14.1% | 26 |
| Optimization | 10/2020–09/2024 | +$5,041 | 2.51 | 21.1% | 57 |
| Classic | 10/2024–09/2026 (forward) | +$453 | 1.62 | 5.3% | 14 |
| Optimization | 10/2024–09/2026 (forward) | +$1,017 | 1.84 | 7.3% | 32 |
Each period was tested separately, starting with $10,000. The result:
- The optimization passed the forward test better than the classic: +$1,017 versus +$453, profit factor 1.84 versus 1.62, and with twice as many trades, so the sample is more reliable.
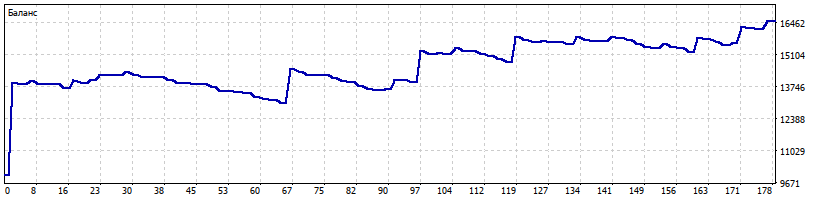
- But the training figures are misleading in both variants. Most of the training profit came from a single October 2020 buy (in the optimization, +$4,315). In the forward test there were no gifts like that, and profitability dropped several times over.
- Over the full 72 months the optimized set returned +$6,530 on $10,000, with a drawdown of up to 21.1% and 89 trades. The classic: +$4,667 with a drawdown of 14.1%.
- Costs: before swaps and commissions the optimization earned $9,036, and bitcoin swaps took $2,449. Holding crypto for weeks with a broker is expensive.
If you re-optimize the robot regularly, you can keep it in shape: the optimized .set shows what result this approach gives on bitcoin. But don’t expect it to repeat 2020.
The risks, with no makeup
- A single trade makes the statistics. On bitcoin, the entire “nice” result of the classic is one 2020 buy. Without a big trend, the system sits still or loses slowly.
- Drawdown of up to 21% in the optimized set during training. With 1% risk per trade that’s a streak of about twenty stops in a row: psychologically heavy. If in doubt, start with 0.5%.
- Swaps. Bitcoin positions last weeks and the swap eats a visible part of the profit. Check your broker’s conditions.
- It works in a narrow space. The optimized set has only been verified on BITCOIN D1. On USDJPY the optimization failed the forward test, and on oil the classic was a failure.
Where to run the robot
The robot runs on MetaTrader 5 with any broker that offers bitcoin as a CFD (BITCOIN/BTCUSD). My test was done on FxPro. The other brokers in my ranking also work: RoboForex and Tickmill. Before launching it, compare bitcoin swaps and the minimum lot.
Download the free Ichimoku robot
The robot is free for clients of the brokers in my ranking:
- Open a MetaTrader 5 account with one of the brokers above (or use the one you already have).
- Go to the Telegram bot with the button and send your account number.
- After verification, the bot sends you the file: the robot, Hosoda’s classic parameters, the ones optimized for BITCOIN D1, and the instructions.
📊 Download the free robot on Telegram
My conclusion
Ichimoku is presented as a whole philosophy of the market. In its mechanical form it’s a normal trend system, based on the cross of two range midpoints, and the cloud is a trend filter. Half of the markets in my test reject it. And where it ends up positive, the result was often made by one lucky trend that won’t repeat.
What survived is the optimized variant on bitcoin: it passed the check with future data, and it passed honestly, with 32 trades. The USDJPY case is worth remembering: 133 “profitable” sets in the history and 18 alive in the future. That’s what overfitting looks like when you check for it. If someone offers you a robot with a perfect curve, ask them first about its forward test.
Today I also published the analysis of the Keltner channel breakout: there the classic loses almost everywhere, and a wide buy-only channel found its money on gold H4. Other analyses: Parabolic SAR + ADX, Elder’s Triple Screen and the Turtles.
Why 72 months?
The market changes fundamentally every 3–5 years: participants and volatility change, and trends give way to ranges. Bitcoin in this test shows it clearly. In the fall of 2020 it was a market with rallies of several times in half a year: a single Ichimoku trade produced almost 40% of the deposit. In 2024–2026 it’s a different asset, with ETFs, institutional investors, and moves that get cut off halfway. The same system started earning several times less. A 10–20 year test would have blended those markets into a single average figure that says nothing about today. You have to choose a strategy for the market that exists now, and change it when the market changes.
That’s why I built my app “Find your strategy”, in the browser or on Telegram. There you can test any idea on a history of up to 72 months, and every 2 weeks the app runs tens of thousands of strategies on its own and shows you the ones that work over the last 6, 12 and 36 months. It doesn’t promise profits: it shows you which strategies are still alive in the current market.
Backtest results do not guarantee future results.
Sources
- Goichi Hosoda (Ichimoku Sanjin) — “Ichimoku Kinkō Hyō,” 1969: Tenkan-sen, Kijun-sen, Senkou A/B, Chikou.
- Manesh Patel — “Trading with Ichimoku Clouds,” 2010: the strong signal of the Tenkan/Kijun cross above the cloud.
- Own tests in MetaTrader 5 on the FxPro demo server, October 2026.
Where to trade
These are the brokers and exchanges I use that work with clients from Latin America. Always check that the service is available in your country and start small.
Risk warning: CFDs, Forex and crypto derivatives carry a high risk of losing money due to leverage. This article is not investment advice.