The inside bar is the “cleanest” pattern in price action: one candle sits completely inside the previous one, the market has compressed, and a move is coming. In my manual trading, almost all entries come from an inside bar, but on the retest of a level. Here I tested the pure mechanical version, with no levels: you place orders at the breakout and let the market choose the side. A robot for MetaTrader 5, 72 months of history, seven instruments. In five of the seven, the classic version loses money. But on gold D1 the pattern passed the forward test more solidly than any strategy from my previous analyses. All the numbers are below; the robot is at the end of the article.
The strategy rules
An inside bar is a candle whose high is below, and whose low is above, those of the previous candle (the “mother bar”). Toby Crabel described these compression days as the preparation for a strong move, and in price action the pattern became a classic. The mechanical version I tested:
- Signal. An inside bar closes: we place a Buy Stop order above its high and a Sell Stop below its low.
- One or the other. If one order is triggered, the other is deleted. If neither is triggered on the next bar, both are deleted.
- Stop loss beyond the opposite extreme of the mother bar. Take profit at 2 stops.
- Position size is calculated so that the stop costs 1% of the deposit.
- No trend filter, D1 timeframe.
It is a breakout strategy: unlike mean reversion with Bollinger, it wins when, after the compression, the market really starts to move.
What it looks like on the chart
Below are two real trades from the robot, from the gold D1 test with the optimized parameters. The first shows how the pattern is supposed to work; the second, how it most often breaks down.
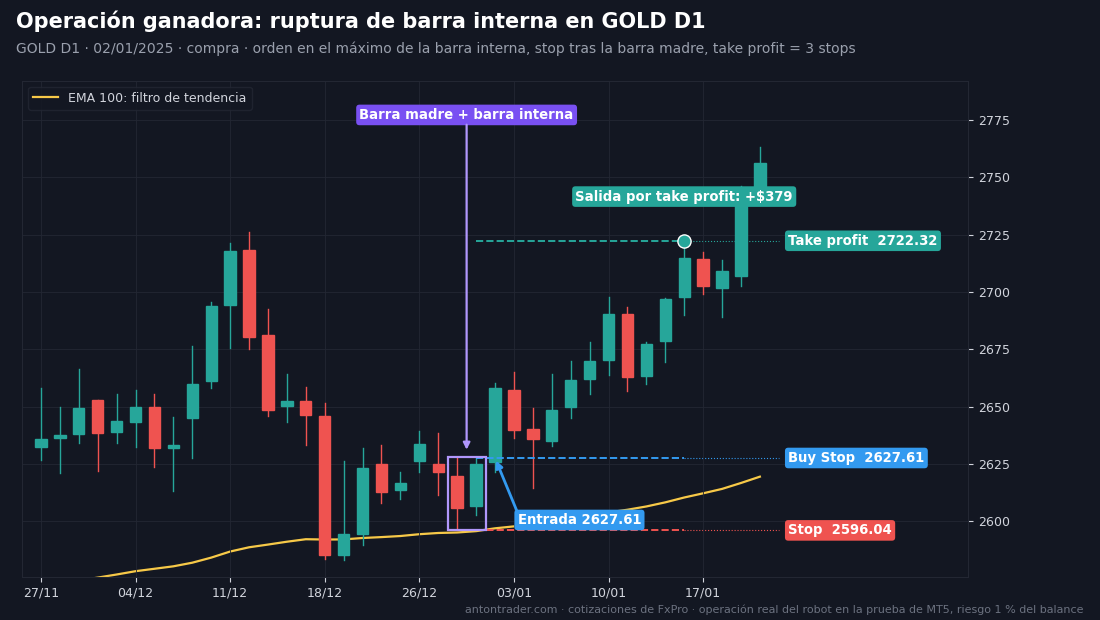
Winning trade. On December 30, 2024, the mother bar forms (high 2628.21, low 2596.04). On December 31, the inside bar: its high of 2627.61 and its low of 2602.58 sit completely inside the mother bar. Price is above the EMA 100, so we only look for buys: Buy Stop at the inside bar’s high, 2627.61. On January 2 the order was triggered. Stop loss below the mother bar, at 2596.04; take profit three times farther away, at 2722.32. The target was reached on January 16: +$379.
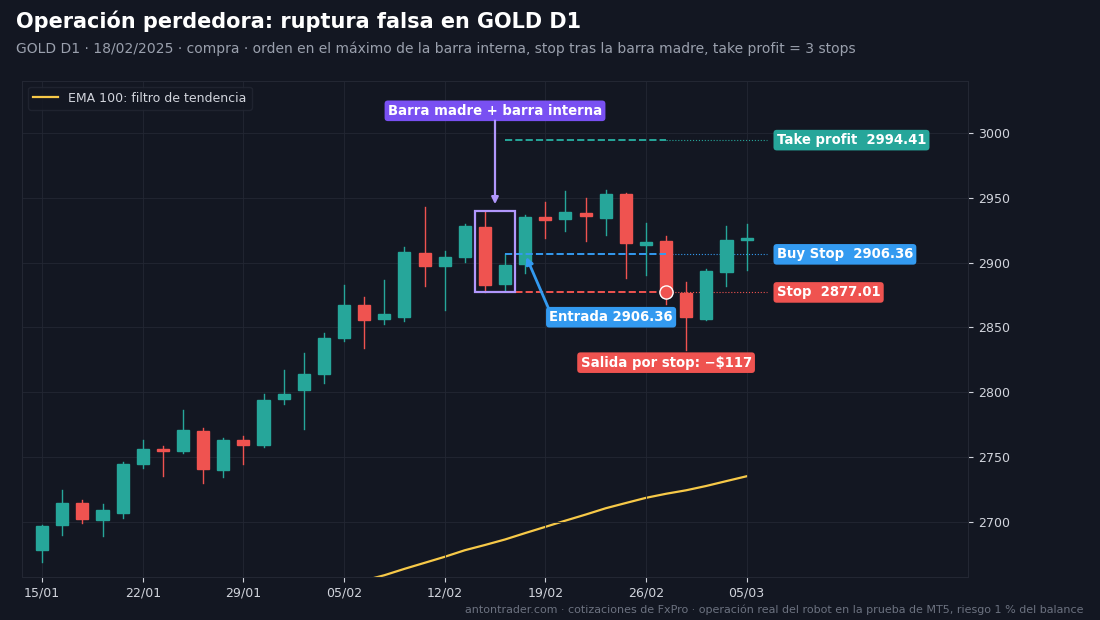
Losing trade. February 14, 2025: mother bar (2940.05–2877.01); February 17: inside bar (2906.36–2878.69). On February 18 price broke the high and the Buy Stop was triggered at 2906.36. But the market did not keep rising: for more than a week gold churned near the top, and on February 27 it dropped below the mother bar and hit the stop at 2877.01: −$117. That is what a false breakout looks like. That is why the take profit is three stops: one winning trade covers three losses like this one.
Doing it by hand is exactly the same: wait for the daily close, look for a candle inside the previous one, check which side of the EMA 100 price is on, and place a single pending order with its stop loss and take profit. If it isn’t triggered within a day, delete it.
How I ran the test
- MetaTrader 5 Strategy Tester, FxPro demo server: the broker’s real quotes, spreads and swaps.
- Period from October 2020 to September 2026, exactly 72 months. $10,000 deposit, 1:100 leverage, 1% risk per trade.
- “1 minute OHLC” mode, the closest to reality among the tester’s fast modes.
I explain at the end why 72 months and not 10 or 20 years. Three blocks: the classic with no adjustments → optimization only on 10/2020–09/2024 → verification on 10/2024–09/2026, months the optimizer never saw.
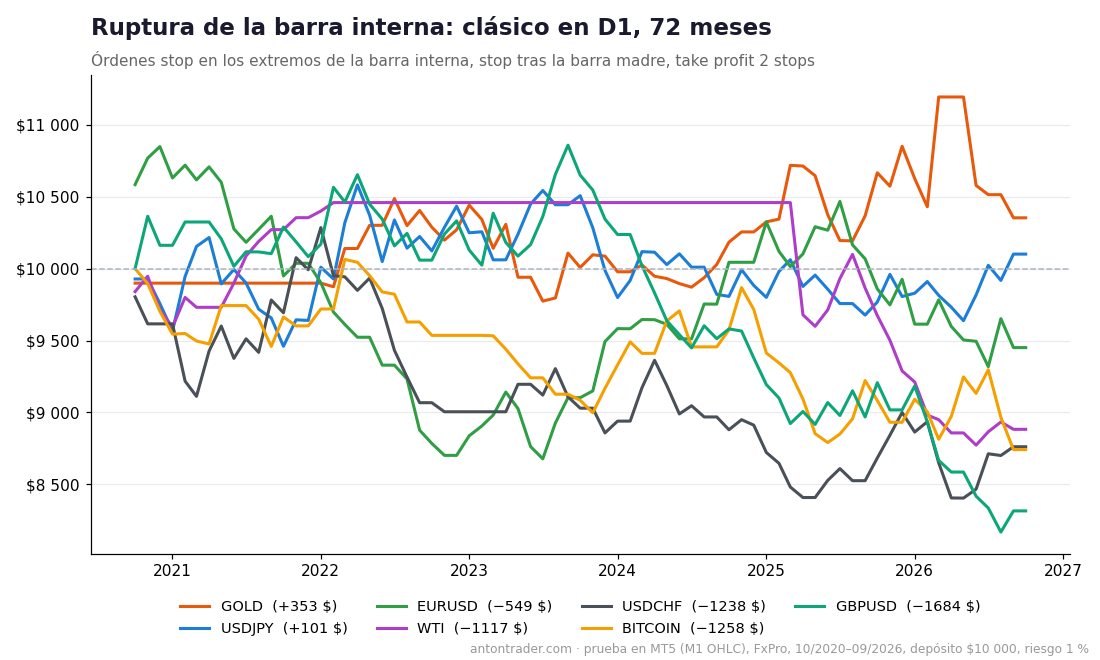
Block 1. The classic over 72 months: positive only on gold and the yen
| Instrument (D1) | Result over 72 months | Profit factor | Max. drawdown | Winning trades | Swaps |
|---|---|---|---|---|---|
| GOLD | +$353 | 1.06 | 10.7% | 36% | −$260 |
| USDJPY | +$101 | 1.01 | 10.7% | 36% | −$266 |
| EURUSD | −$549 | 0.92 | 21.6% | 34% | −$484 |
| WTI (oil) | −$1,117 | 0.70 | 18.4% | 31% | −$1,411 |
| USDCHF | −$1,238 | 0.83 | 19.8% | 32% | −$636 |
| BITCOIN | −$1,258 | 0.84 | 15.8% | 31% | −$764 |
| GBPUSD | −$1,684 | 0.77 | 25.6% | 29% | −$297 |
Around 100 trades in each market: the sample is enough. And it is harsh:
- Most breakouts are false. With a take profit of 2 stops you need about 33% winning trades to break even. On the pound, the franc, bitcoin and oil it is between 29% and 32%, and that burns the account.
- Compression with no direction. Without a trend filter, the robot buys and sells with equal enthusiasm. In a range, an upward breakout is followed by a downward one and stops pile up on both sides.
- Swaps on oil took $1,411 over 72 months, more than the entire loss.
- Gold and the yen are the only markets where breakouts reached the target more often. But +$353 in six years is still not an edge; it is noise around zero.
Block 2. Optimization on 10/2020–09/2024
I optimized three variants: gold D1, gold H4 and USDJPY D1. I tuned the trend filter (EMA from 0 to 200), where to enter (inside bar or mother bar), where to place the stop loss, the take profit from 1 to 3 stops, order lifetime, a forced exit after N bars, the offset from the level, and sells.
- GOLD D1: of the sets with more than 20 trades, 98 were profitable in training and of those 95 stayed positive in the forward test. I hadn’t seen stability like that in any of my analyses.
- GOLD H4: only 6 profitable in training. On the four-hour chart there are more inside bars, but almost all of them are noise.
- USDJPY D1: 134 profitable in training and 99 survived in the forward test. But the best training sets (+$2,800) ended up negative in the forward test. The classic overfitting trap.
For gold D1 I chose the set that departs the least from the classic, with just two changes:
| Parameter | Classic | Optimization (GOLD D1) |
|---|---|---|
| Trend filter | none | EMA 100: buys above, sells below |
| Take profit | 2 stops | 3 stops |
| Entry | at the inside bar extremes | at the inside bar extremes |
| Stop loss | beyond the mother bar | beyond the mother bar |
| Order lifetime | 1 bar | 1 bar |
| Direction | buys and sells | buys and sells |
Block 3. Forward 10/2024–09/2026
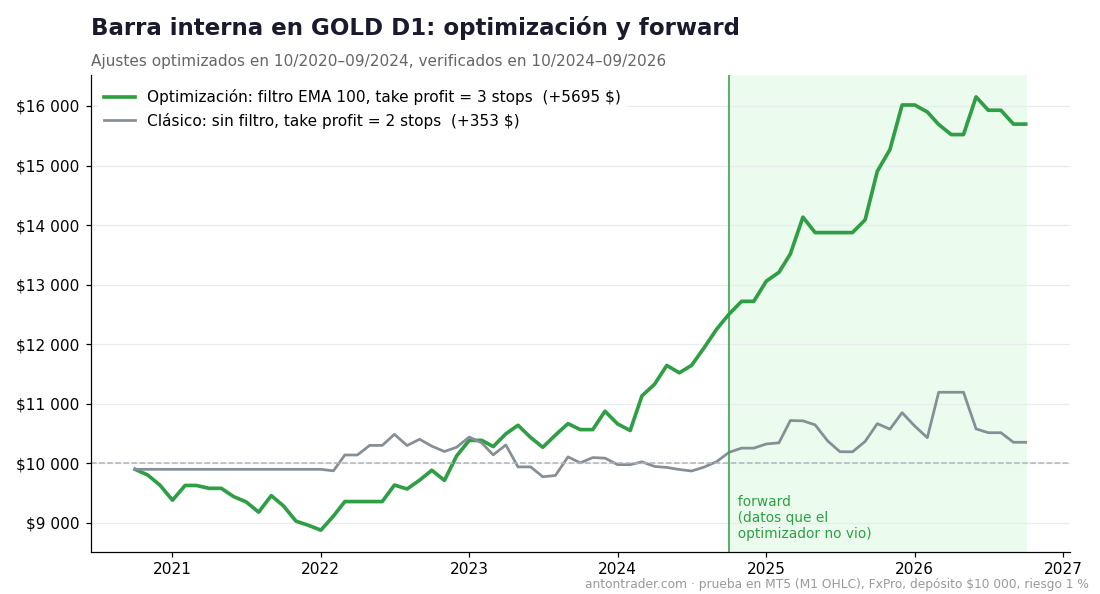
| Variant | Period | Result | Profit factor | Max. drawdown | Trades |
|---|---|---|---|---|---|
| Classic | 10/2020–09/2024 | +$97 | 1.03 | 8.9% | 62 |
| Optimization | 10/2020–09/2024 | +$2,323 | 1.63 | 11.9% | 63 |
| Classic | 10/2024–09/2026 (forward) | +$103 | 1.04 | 10.9% | 42 |
| Optimization | 10/2024–09/2026 (forward) | +$2,369 | 2.84 | 5.0% | 28 |
Each period was tested separately, starting with $10,000. The result:
- Forward test passed with room to spare. Over 24 months the optimizer never saw: +$2,369 and a profit factor of 2.84, better than in training. Winning trades in the forward test were 54%.
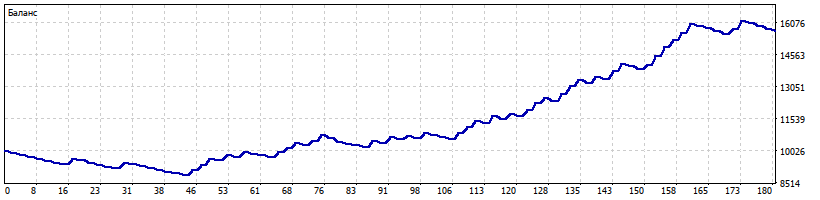
- Over the full 72 months the optimized set produced +$5,695 on $10,000, profit factor 2.08, drawdown up to 11.9% and 90 trades, about 15 per year.
- The classic, over the same months, goes nowhere: +$97 and +$103. The whole difference is in the trend filter: it eliminates breakouts against the move, and the 3-stop take profit lets winners run farther.
- 95 of 98 sets that were profitable in training stayed positive in the forward test. It isn’t a lucky number: it is a stable property of gold on the daily chart.
- Costs: before swaps and commissions the robot earned $6,784; swaps took $1,066.
The risks, without makeup
- The forward test coincided with a strong trend in gold. The EMA 100 filter wins in a trend. In a long range there will be streaks of small losses, like those of the classic in 2020–2023.
- It works in a very narrow space. In my tests, only on gold D1. It isn’t worth launching the same idea on H4 or on currencies without testing it.
- Drawdown of up to 11.9% in training. For the first 15 months of the test the robot was in the red. That is normal in a breakout system, but you have to be prepared.
- Few trades. About 15 per year: a month without a signal is normal.
Where to run the robot
The robot works on MetaTrader 5 with any broker that offers gold (GOLD/XAUUSD). My test was run on FxPro. The other brokers in my ranking also work: RoboForex and Tickmill. Before launching it, compare gold swaps: over this holding distance they take a noticeable part of the profit.
Download the “Inside Bar” robot for free
The robot is free for clients of the brokers in my ranking:
- Open a MetaTrader 5 account with one of the brokers above (or use the one you already have).
- Go to the Telegram bot with the button and send your account number.
- After verification, the bot sends you the file: the robot, the classic inside bar breakout parameters and those optimized for GOLD D1, plus the instructions.
📊 Download the robot for free on Telegram
My conclusion
The pure inside bar breakout, in five of seven markets, is a stop-collecting machine. Compression by itself promises nothing: the market can shoot off in either direction, or simply churn and take you out both ways. Anyone who trades the “textbook” pattern with no context is paying the market.
But add a single condition, the direction of the trend, and on gold D1 the pattern becomes a system that passed the forward test better than training, along with 95 of 98 neighboring sets. The inside bar works when it is clear which way the majority is pushing. If you keep optimizing the robot consistently, you can keep it in shape: the optimized .set shows what result that approach gives.
Today I also published the analysis of MACD + EMA 200: the classic from the videos doesn’t work anywhere, but the reworked version also found its money in gold. Other analyses: the Turtles, the classic channel breakout, the “golden cross” and Bollinger Bands.
Why 72 months?
The market changes fundamentally every 3–5 years: participants and volatility change, and trends give way to ranges. This test shows it clearly. The classic inside bar on gold spent four years going nowhere: in 2020–2023 gold moved in a wide range and breakouts fizzled out. Since 2024 the market is different, and the breakout in the direction of the trend started to pay. If you test a strategy over 10–20 years, those different markets blend into an average figure that says nothing about what works today. The market changed: change the strategy.
To find strategies for the current market I use my app “Find your strategy”, in the browser or on Telegram. Any idea, even this very inside bar, can be tested there on up to 72 months of history, and every 2 weeks the app automatically runs tens of thousands of strategies and shows you the ones that work over the last 6, 12 and 36 months. It doesn’t promise profits: it shows you what works now and what was left behind in the previous cycle.
Backtest results do not guarantee future results.
Sources
- Toby Crabel — “Day Trading with Short Term Price Patterns and Opening Range Breakout”, 1990 (compression days, inside day).
- My own tests in MetaTrader 5 on the FxPro demo server, October 2026.
Where to trade
These are the brokers and exchanges I use that work with clients from Latin America. Always check that the service is available in your country and start small.
Risk warning: CFDs, Forex and crypto derivatives carry a high risk of losing money due to leverage. This article is not investment advice.