A robot that closes trades in profit every single day is every trader’s dream. The grid that doubles the lot looks exactly like that: the position goes into a loss, the robot buys double, the average price gets closer, and the basket closes in profit again. The report shows 70% winning trades and a balance curve that only goes up. I coded a robot like this, with the classic scheme, and ran it on seven markets. I’ll show you how it ended, so your deposit doesn’t repeat it. And at the end, the robots that did pass the test.
- All 7 accounts went to zero within 11 weeks. The classic grid (1 ATR step, lot ×2, no stop) on H1 blew up the deposit in every market: from 5 days on oil to 11 weeks on GBPUSD.
- Before the blow-up, everything looked perfect: on GBPUSD the balance rose from $10,000 to $249,143 in 10 weeks; on gold, to $73,375 in 4 weeks. Then a single basket took it all.
- Optimization didn’t save it: of 36 variants with limits (smaller multiplier, order cap, basket stop), 11 were profitable in training, and with a drawdown under 25%, only 2. One step away from the best one, and losses again.
- What works better: the TTM Squeeze robot on gold: +55% in 72 months with a 4.7% drawdown, forward +36%. A stop on every trade and 1% risk.
📊 Download the TTM Squeeze robot for free, the one that actually works
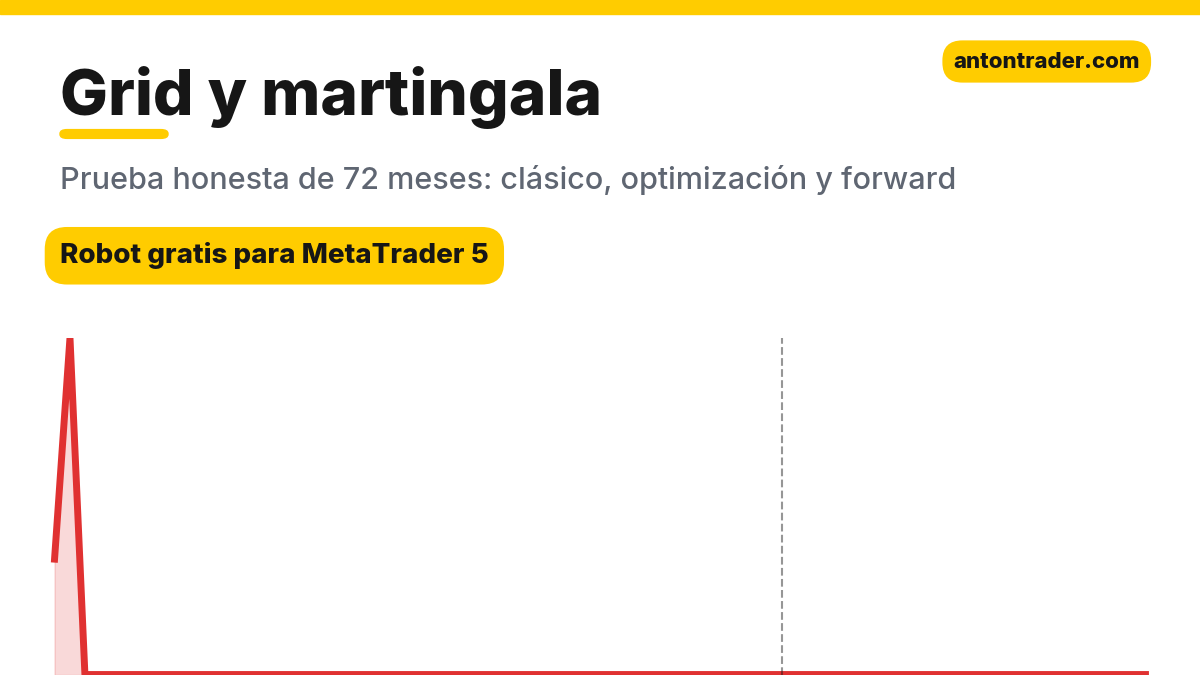
The strategy rules
Doubling your bet after a loss, the martingale, comes from the French gambling houses of the 18th century. Why this scheme, with limited capital, sooner or later ruins the player has been explained by mathematicians for a long time: it’s the classic “gambler’s ruin problem,” which William Feller analyzes in depth in “An Introduction to Probability Theory and Its Applications.” In Forex the martingale lives on in the form of a grid: the robot doesn’t place a stop, it averages down instead. My robot trades the most common version:
- First trade: in the direction of the 50-period simple moving average (SMA) on H1: price above the average, buy; below, sell. Initial lot: 0.1 per $10,000 of balance.
- Grid: if the price moves against the position by 1 ATR(14), the robot opens another trade in the same direction, with a lot twice as large as the previous one: 0.1 → 0.2 → 0.4 → 0.8…
- Exit: the entire basket closes when the price returns 1 ATR in its favor from the average price of all trades.
- There is no stop. There is no order limit either. This is how most of the “loss-free” grid robots sold online work.
What it looks like on the chart
Below are two real baskets from the robot on EURUSD H1, from the classic test. The first is the reason people want the grid. The second is how it ends.
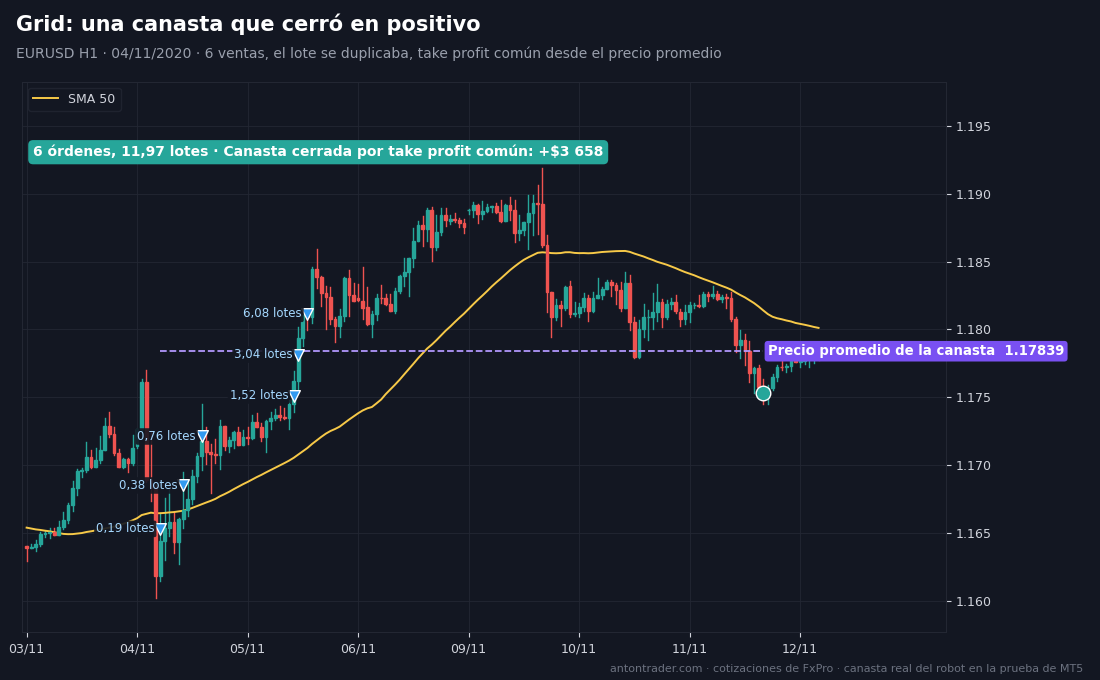
The basket that closed in profit. On November 4, 2020, EURUSD was below the SMA 50, and the robot sold 0.19 lots at 1.1653. But the euro went up. Every 1 ATR the robot added a sell with a doubled lot: 0.38, 0.76, 1.52, 3.04 and 6.08 lots. In a day and a half, six trades and almost 12 lots against the move. The basket’s average price rose to 1.1784. On November 11 the euro pulled back and the whole basket closed at the common take profit: +$3,658, the balance grew 19%. Trades like this are exactly what create the feeling that the grid doesn’t lose.
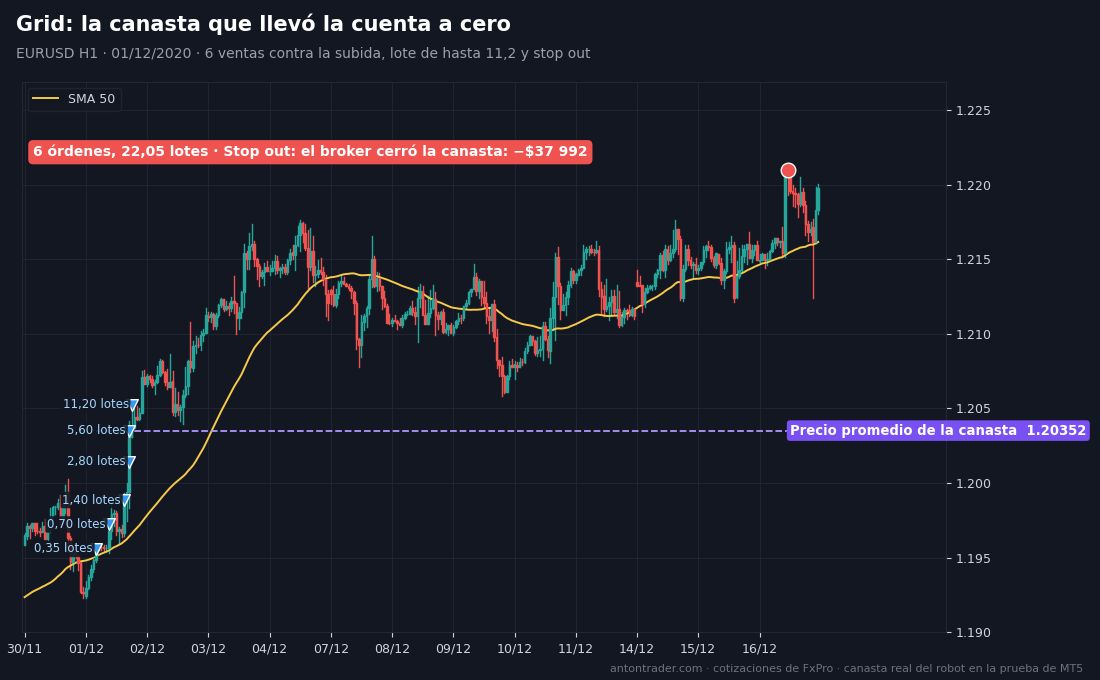
The basket that took the account to zero. On December 1, 2020, the balance was already $35,939, 3.6 times the initial amount. The robot sold 0.35 lots at 1.1956, the euro went up and in a single day the grid grew to six sells: 0.7, 1.4, 2.8, 5.6 and 11.2 lots, 22 lots against a bullish market. The basket’s average price: 1.2035; the euro went past 1.22 and never came back. On December 16 the broker closed the positions with a stop out: −$37,992. A single basket took everything the grid had earned in two months, and the deposit too.
By hand it looks the same: you open a trade, the price goes against you, you buy double, you wait for the pullback to the average and close everything in profit. As long as the market pulls back, it works. The day it doesn’t, the lot doubles faster than your nerves run out, and before the margin runs out.
How I ran the test
MetaTrader 5 Strategy Tester, FxPro demo account with its quotes, spreads, commissions and swaps. Period: October 2020 to October 2026, 72 months. $10,000 deposit, 1:500 leverage, “1 minute OHLC” mode. I’ll explain at the end why exactly 72 months. Although the classic grid needed far less than that.
The grid over 72 months: no account made it to 2021
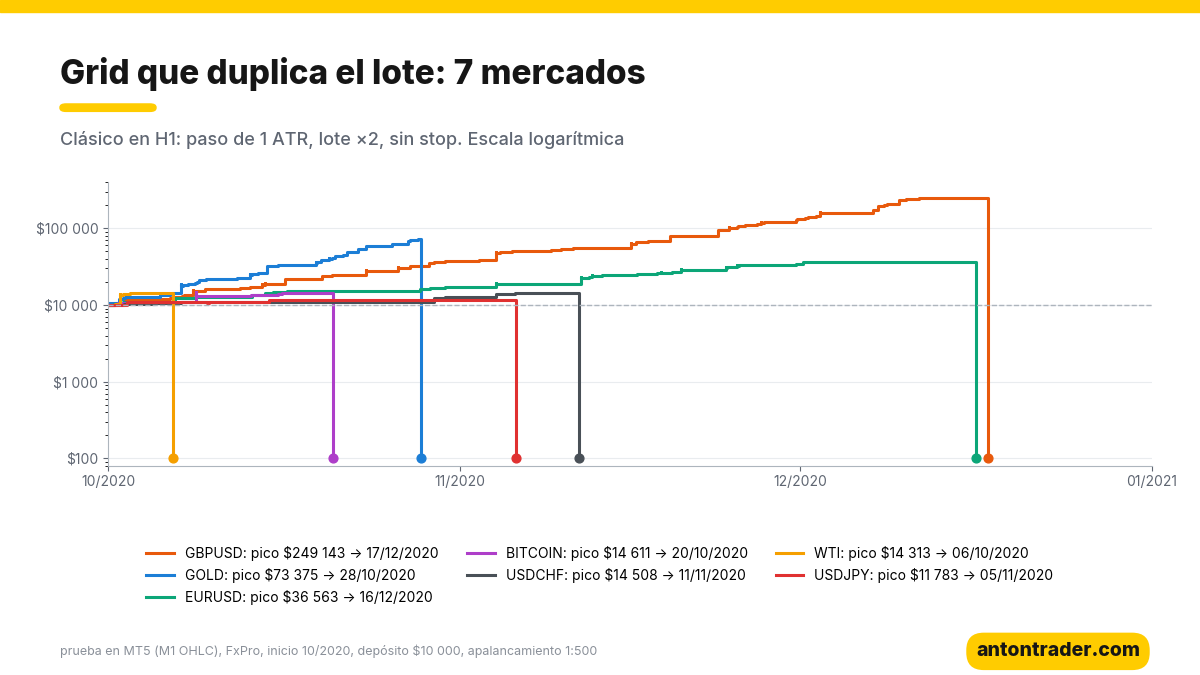
| Instrument (H1) | Balance peak | Deposit at zero | Winning trades | Result |
|---|---|---|---|---|
| GBPUSD | $249,143 | 12/17/2020 | 72% | −100% |
| GOLD | $73,375 | 10/28/2020 | 70% | −100% |
| EURUSD | $36,564 | 12/16/2020 | 65% | −100% |
| BITCOIN | $14,611 | 10/20/2020 | 62% | −100% |
| USDCHF | $14,509 | 11/11/2020 | 74% | −100% |
| WTI (oil) | $14,314 | 10/06/2020 | 55% | −100% |
| USDJPY | $11,783 | 11/05/2020 | 64% | −100% |
In four markets out of seven, the account actually went negative before the blow-up: on gold the balance ended at −$50,518. 1:500 leverage lets you open a huge lot, and the price manages to move beyond the forced-close level. Many brokers forgive that negative balance, but that doesn’t change the essential point: the deposit no longer exists.
- A high percentage of winning trades is a trap. Between 55% and 74% of trades in profit, and each win is small. But a single loss is the size of all the wins combined.
- Doubling grows faster than it seems. Six grid steps mean a lot 32 times larger than the initial one and a total volume 63 times larger. A move of 6–7 ATR with no pullback is enough, and on H1 that happens every few weeks.
- The better everything was going, the harder the fall. The initial lot grows along with the balance, so the biggest basket arrives at the moment of greatest success. On GBPUSD the robot made almost $240,000 in 10 weeks and lost it in a few days.
What if we optimize the parameters?
Grid defenders usually answer: you just have to limit the risk. That’s what I did: I gave the optimizer a grid with limits on EURUSD H1: lot multiplier of 1.5 or 2, no more than 5 or 8 orders, a stop on the whole basket at a loss of 10% or 20% of the balance (or no stop), grid step of 1, 2 or 3 ATR and an initial lot five times smaller: 0.02 per $10,000. The optimization was done only on 10/2020–09/2024; afterward I checked what it found on 10/2024–09/2026, months the optimizer never saw.
- Of 36 variants, 11 were profitable in training. But nine of them have a drawdown of 30% to 95%. The most profitable one (+269% in four years) lost 95% of the account along the way, meaning it survived by a miracle.
- With a drawdown under 25%, there are only two profitable variants. The best: lot ×1.5, no more than 5 orders, 20% basket stop. In training, +30.0% with a 20.5% drawdown; in the forward test, +51.9% with a profit factor of 3.28. Over 72 months, +107.1%.
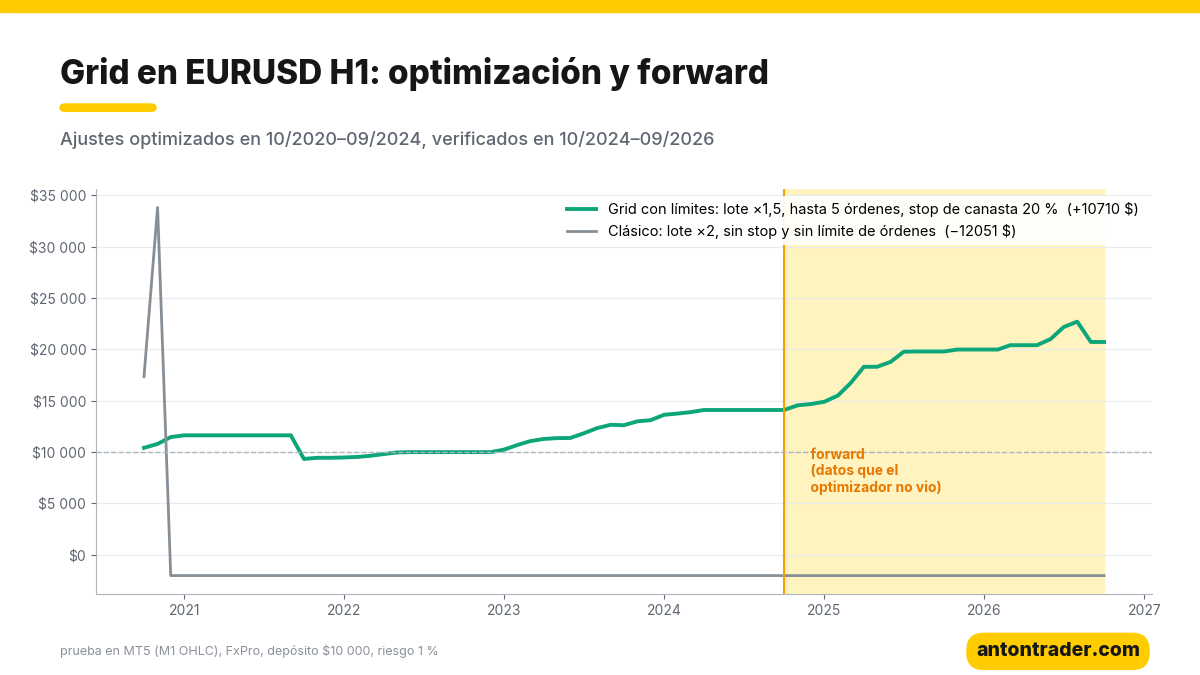
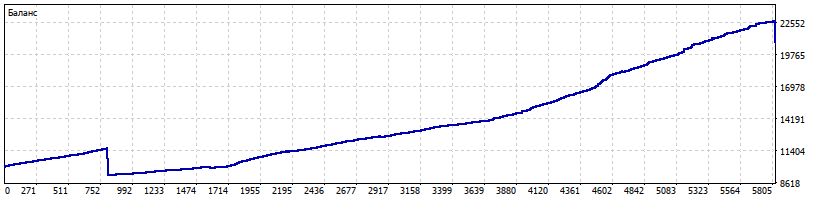
Formally, this variant passed the forward test. But I don’t recommend it, and I’ll explain why. One step to the side and the result breaks: the same set with a 10% basket stop loses 9% in training; with an 8-order limit, 16%; with multiplier 2, 6%. For 2.5 years, from January 2021 to July 2023, the balance failed to surpass its peak. And this is no longer a “loss-free grid”: a basket stop of 20% of the balance is a single loss the size of twenty stops from a normal robot risking 1%. When out of 36 settings one survives and its neighbors lose money, that is overfitting to the historical data, not an edge.
What to use instead of the grid: robots that passed the test
In the same 72-month test, these robots held up under verification with data the optimizer never saw. Every trade has a stop, and the risk is a fixed percentage of the balance. That’s why their worst trade is a loss of about 1% of the balance, not of the whole account:
| Robot | In 72 months | Max drawdown | Forward 10/2024–09/2026 |
|---|---|---|---|
| TTM Squeeze, GOLD H4 | +55.0% | 4.7% | +36.1%, profit factor 2.73 |
| Heikin-Ashi, GOLD H4 | +96.4% | 13.8% | +54.4%, profit factor 1.71 |
| Supertrend, USDJPY H4 | +40.2% | 4.8% | +11.3%, profit factor 2.24 |
| For comparison: classic grid (7 markets, H1) | −100% on each | deposit at zero | didn’t reach the forward test |
📊 Download the TTM Squeeze robot for gold
📊 Download the Heikin-Ashi robot for gold
Where to run them and how to download them
The robots work on MetaTrader 5 with any broker. My test was done on FxPro. The other brokers in my ranking also work: RoboForex and Tickmill. The robots are free for clients of these brokers:
- Open a MetaTrader 5 account with one of the brokers above (or use the one you already have).
- Enter the Telegram bot with the button and send your account number.
- After verification, the bot sends you the file: the robot, the ready-made parameters and the instructions. Run it in your broker’s tester (it takes an afternoon) and put it live.
If you want to see with your own eyes how a grid works, the bot also has the “Grid and martingale” robot, with the classic and the optimized parameters, for the tester only. It’s not worth putting on a real account.
My conclusion
The grid that doubles the lot doesn’t eliminate losses: it postpones them and bundles them into a single one. As long as the market pulls back, the report looks impeccable: dozens of winning baskets in a row and a balance that grows faster than any strategy with a stop. But in our test the classic grid blew up all seven accounts in under three months. Optimization with limits found, out of 36 variants, one survivor, and it rests on a single lucky combination of numbers. If you see a robot with a perfect curve and 80% winning trades, first check whether it doubles the lot and whether it has a stop. Protect your deposit: trade with a clear risk on every trade, as TTM Squeeze and Heikin-Ashi do on gold.
Today I also published the analysis of the TTM Squeeze robot: it passed the test on gold, and each of its trades has a stop. Earlier, double top and double bottom and pivot trading did not pass the test. Other analyses: the first-hour London breakout and the inside bar breakout.
Why 72 months?
The market changes fundamentally every 3–5 years: participants and volatility change, and trends give way to ranges. That’s why I don’t run 10–20 year tests: they mix different markets into a single average figure, and after a market change you have to change the strategy anyway. With the grid that question never even came up: the classic one couldn’t last even the first three months of the 72. A good test shows not only how much a strategy earns, but whether it survives a change in market regime, and the grid breaks at the first strong move without a pullback.
To search for strategies for the current market I built my app “Find your strategy”, in the browser or on Telegram. There you can test any idea on up to 72 months of history, and every 2 weeks the app automatically runs tens of thousands of strategies and shows you the ones that work over the last 6, 12 and 36 months. It doesn’t promise profits: it helps you tell a strategy with a clear risk from a pretty curve that hides a blow-up.
Backtest results do not guarantee future results.
Sources
- William Feller: “An Introduction to Probability Theory and Its Applications,” Vol. 1, the gambler’s ruin problem.
- Own tests on MetaTrader 5 on the FxPro demo server, October 2026.
Where to trade
These are the brokers and exchanges I use that work with clients from Latin America. Always check that the service is available in your country and start small.
Risk warning: CFDs, Forex and crypto derivatives carry a high risk of losing money due to leverage. This article is not investment advice.