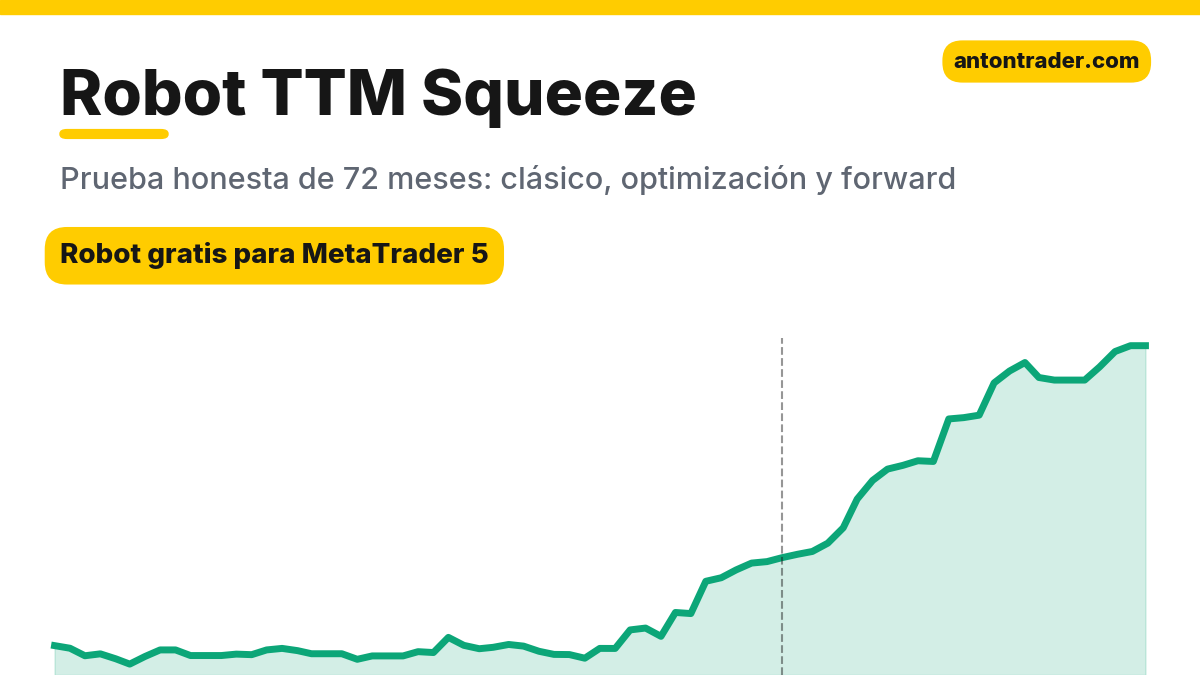
A range in gold is the most boring moment on the chart. Price compresses, the candles get small, and it looks like nothing is happening. But in reality the market is storing up energy for the next impulse. John Carter built the TTM Squeeze indicator on that observation: it shows the moment when the compression has ended and the move has begun. I ran Carter’s classic rules on seven markets over 72 months and found a version that held up through two years of data the optimizer never saw. It’s a robot for gold on H4. I’ll show you what it did, what its trades look like, where its risks are, and how to download it for free.
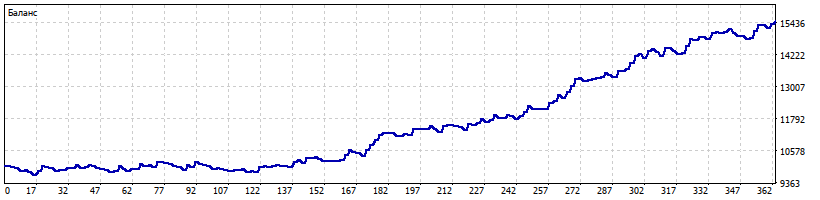
- +55% in 72 months on GOLD H4, with 1% risk per trade. Maximum drawdown: 4.7%.
- +36% in the forward test (10/2024–09/2026) with a profit factor of 2.73: the robot made money on data it didn’t see during tuning.
- With 2% risk per trade, the same robot gave +148% in 72 months with a 9.5% drawdown.
- In the file: the robot for MetaTrader 5, the .set file for GOLD H4, and instructions. It’s up and running in 5 minutes.
📊 Download the free robot on Telegram
What the robot does
TTM Squeeze was created by John Carter (John F. Carter), who explains it in detail in his book “Mastering the Trade,” in the chapter on the squeeze. The idea is simple: Bollinger Bands measure volatility using standard deviation, while the Keltner Channel uses the average true range. When the market calms down, the Bollinger Bands narrow further and hide inside the Keltner Channel: that’s the squeeze. When they come back out, the squeeze has “fired.” The direction is given by the momentum histogram: above zero, you buy; below zero, you sell. The robot works like this:
- Squeeze: on H4, the Bollinger Bands (10, 2) are inside the Keltner Channel (10, 1.75 ATR) for at least 3 consecutive candles.
- Entry: the Bollinger Bands have come out of the channel, the momentum histogram is above zero, and price closed above the EMA 100. The robot buys at the open of the next candle. There are no sells: buys only, in line with gold’s main move.
- Stop: 1 ATR(14) from the entry price. Take profit: two stops.
- Early exit: if the momentum histogram starts to fall or drops below zero, the robot closes the trade without waiting for the stop. This is what Carter himself recommends: exit when the impulse weakens.
- Position size: based on risk as a % of balance. In the test, 1%; in the parameters you can set your own.
It’s a trend robot for the pauses within a bull market: it waits for gold, above the EMA 100, to go quiet in a narrow corridor, and buys the moment the corridor breaks upward. It closes 52% of its trades in profit, and the early exit on weak momentum keeps it from staying long in a trade that has already stopped working.
What it looks like on the chart
Below are two real trades by the robot in the GOLD H4 test. Both are from the forward period, which the optimizer didn’t see: one winner and one loser, so you can see the robot as it is. At the top are the candles, the Bollinger Bands (blue) and the Keltner Channel (dotted yellow); in purple, the squeeze. Below, the momentum histogram and the squeeze dots, as in Carter’s indicator.
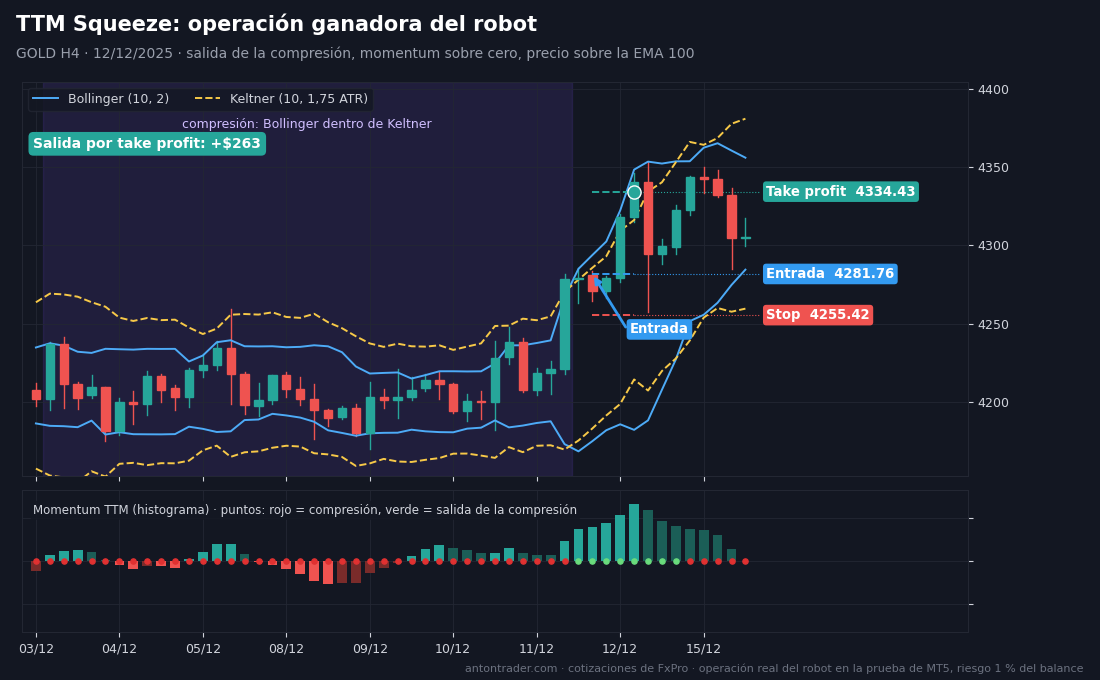
Winning trade. In early December 2025, gold spent more than a week in a narrow corridor: the Bollinger Bands hid inside the Keltner Channel, and the red squeeze dots appeared in the lower panel. On December 11 the bands came out, the momentum histogram rose above zero, and price was above the EMA 100. The robot bought at the open of the next candle, at 4281.76, with a stop at 4255.42 (1 ATR) and a take profit at 4334.43. Twelve hours later gold reached the target: +$263.
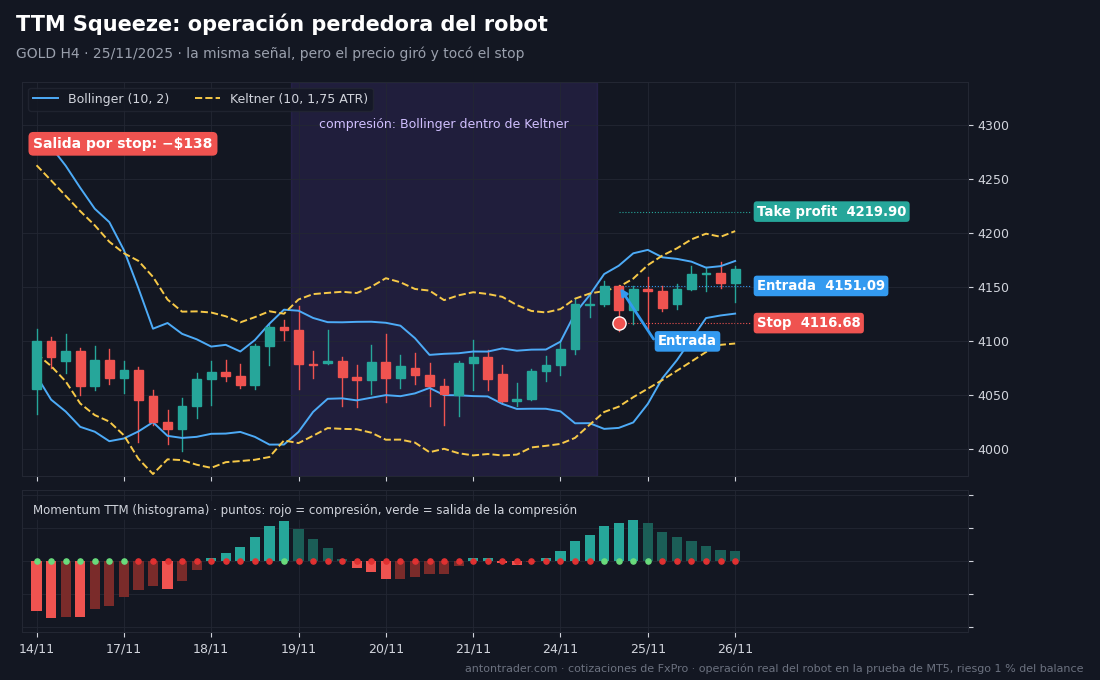
Losing trade. From November 19 to 24, 2025, gold also compressed into a corridor. On November 25 the Bollinger Bands came out of the channel, the histogram was above zero, and price was above the EMA 100: all conditions were met. The robot bought at 4151.09, with a stop at 4116.68 and a take profit at 4219.90. But three hours later gold pulled back hard and hit the stop: −$138. A squeeze release doesn’t guarantee the move will continue; sometimes it’s just a spike. Here the stop is the price of getting into the moves that pay a take profit twice as large.
By hand: open the gold chart on H4 and add the Bollinger Bands (10, 2) and the Keltner Channel (10, multiplier 1.75 on the ATR), or a ready-made TTM Squeeze indicator with those parameters. Add an EMA 100. Wait for the Bollinger Bands to spend at least three candles inside the Keltner Channel. When they come out, with the histogram above zero and price above the EMA 100, buy. Stop at 1 ATR(14) below the entry; take profit at twice that distance. If the histogram starts to fall earlier, exit.
Robot results: training and forward
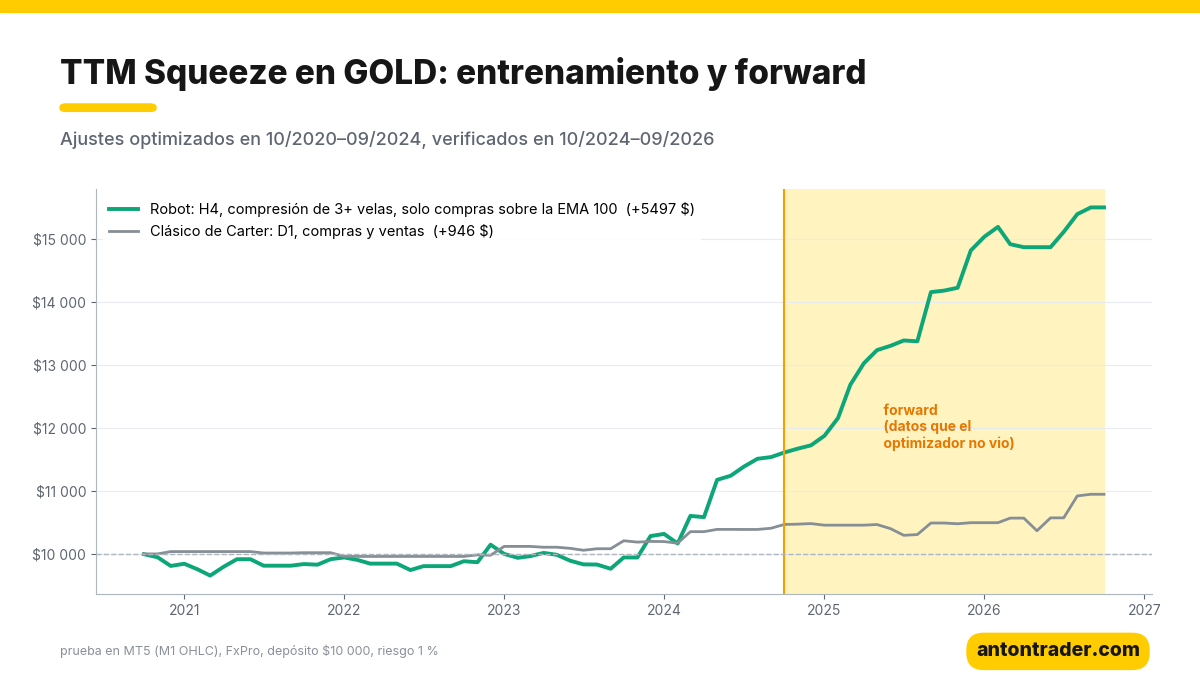
To avoid fooling myself with overfitting, I split the history into two parts. The parameters are chosen using only 10/2020–09/2024. Then the robot takes the exam on 10/2024–09/2026, months the optimizer didn’t see. The test: MetaTrader 5 strategy tester, FxPro demo account with its quotes, spreads, commissions and swaps, $10,000 deposit, 1:500 leverage, “1 minute OHLC” mode.
| Period (GOLD H4) | Return | Profit factor | Max drawdown | Trades |
|---|---|---|---|---|
| Training, 10/2020–09/2024 | +15.4% | 1.49 | 4.7% | 105 |
| Forward, 10/2024–09/2026 | +36.1% | 2.73 | 3.8% | 76 |
| All 72 months, 1% risk | +55.0% | 1.99 | 4.7% | 181 |
| All 72 months, 2% risk | +147.9% | 2.07 | 9.5% | 181 |
The most important thing here is the forward test. On unknown data, the robot earned more in two years than in the four years of training, and the profit factor rose from 1.49 to 2.73. I’ll tell you frankly where that jump comes from: in the two forward years gold rose enormously, and the robot happens to buy the exit from pauses in a bull market. What matters most to me is stability: of 625 profitable parameter sets in training, 621 stayed positive in the forward test, and the neighboring settings (stop of 1–3.5 ATR, take profit of 1–4 stops) also make money. In other words, the robot doesn’t depend on a single lucky number. Over the 72 months the drawdown never exceeded 4.7%: for a trend robot, that’s a very calm curve. Commissions took $105, and the swaps on gold buys at FxPro took $475.
📊 Download the robot and the parameters for GOLD H4
Why the “internet” TTM Squeeze doesn’t work and this one does
First I ran TTM Squeeze as Carter describes it and as it’s usually recommended: daily chart, Bollinger Bands (20, 2) inside the Keltner Channel (20, 1.5 ATR), entry in the direction of the histogram on the first candle after the squeeze, buys and sells, exit after two candles of weakening momentum, 2 ATR stop. Seven markets, 72 months:
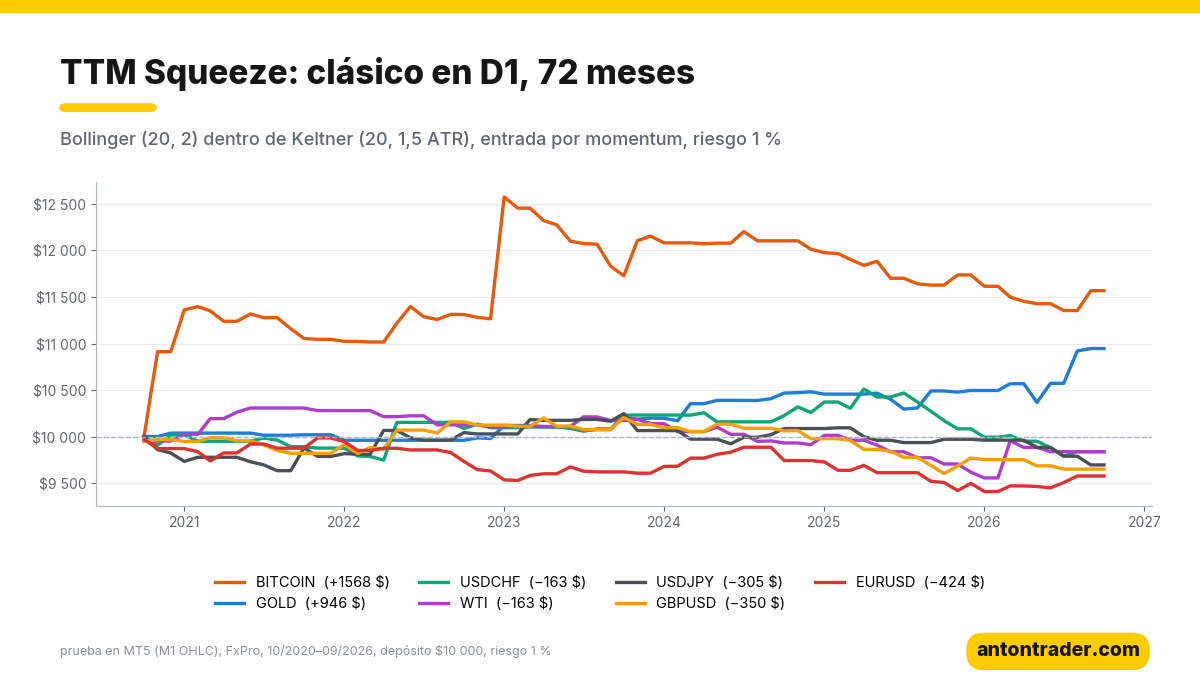
| Instrument (D1) | Result | Profit factor | Max drawdown | Trades |
|---|---|---|---|---|
| BITCOIN | +15.7% | 1.57 | 11.1% | 64 |
| GOLD | +9.5% | 2.04 | 6.1% | 44 |
| USDCHF | −1.6% | 0.90 | 9.4% | 43 |
| WTI (oil) | −1.6% | 0.87 | 7.9% | 36 |
| USDJPY | −3.1% | 0.80 | 6.1% | 42 |
| GBPUSD | −3.5% | 0.77 | 6.5% | 47 |
| EURUSD | −4.2% | 0.73 | 6.7% | 52 |
Positive only on bitcoin and gold; in five of seven markets, a small loss. There are three reasons:
- Too few trades. On the daily chart, a squeeze with a release happens 6–11 times a year. Over six years that’s 36–64 trades, and the result is decided by a few good or bad moves.
- Sells against the main move. In these years gold doubled in price, and the classic version sold every squeeze release with the histogram below zero.
- No take profit and no trend filter. A wide 2 ATR stop on the daily chart and an exit only on weak momentum: in a range, the trade hangs around for a long time and closes near zero or at a loss.
The robot that works differs in exactly that: H4 instead of D1, shorter bands (10 instead of 20), a squeeze of at least 3 candles, buys only above the EMA 100, and a clear take profit of two stops. Carter’s idea, the squeeze and the momentum exit, stayed the same. For comparison: the classic parameters on the same GOLD H4 gave +10% in 72 months with a 15.9% drawdown. On bitcoin H4 the tuning wasn’t stable: of 76 profitable parameter sets in training, 58 stayed positive in the forward test. That’s why the robot is configured only for GOLD H4, and I don’t recommend taking it to other markets without your own test.
The risks, with no makeup
- The robot only buys gold. The forward test coincided with a strong rally in gold. When price is below the EMA 100, the robot stays idle: in the test, from mid-April to the end of July 2026 it didn’t make a single trade. In a long decline it will trade little, and in a wide range it will hit the stop more often.
- Streaks of stops are normal. It wins 52% of its trades, so several stops in a row are a regular part of the job. Choose a risk level you can sit through calmly.
- 2% risk also doubles the drawdown: 9.5% instead of 4.7%. I would start with 1% and raise the risk only after seeing the robot work live with you.
- Swaps on gold buys are negative. In the test they took $475 over six years; with your broker the figure may be different.
Where to run the robot
The robot works in MetaTrader 5 with any broker that offers gold (XAUUSD / GOLD). My test was done on FxPro. The other brokers in my ranking also work: RoboForex and Tickmill. Before putting it on your account, run it in your broker’s tester: it takes an afternoon and shows you how it behaves with your quotes and your swaps. For it to work without pauses, leave the platform on a VPS: the robot needs to see the close of every H4 candle.
Download the TTM Squeeze robot for free
The robot is free for clients of the brokers in my ranking:
- Open a MetaTrader 5 account with one of the brokers above (or use the one you already have).
- Go to the Telegram bot with the button and send your account number.
- After verification, the bot sends you the file: the robot, the parameters for GOLD H4, the classic TTM Squeeze parameters for your own experiments, and the instructions.
📊 Download the free robot on Telegram
My conclusion
TTM Squeeze in its classic form is a good indicator, but not a system: on the daily chart it trades little and sells against the main move, which is why it loses in five of seven markets. But Carter’s idea, that after the silence the market fires, works on gold. If you listen only to the upward shots, on H4 and with a clear take profit, you get a robot that earned 55% over 72 months with a drawdown of just 4.7%, and that earned more in two unknown years than in four years of training. The forward test confirmed it, and almost all neighboring settings behaved the same way; that’s why I have confidence in this robot. Protect your deposit: start on demo and with a small risk.
Today I also published the analysis of the grid that doubles the lot: it shows how a robot with 70% winning trades takes the deposit to zero, and why the stop on every trade matters more than a pretty curve. Heikin-Ashi on gold, Supertrend on USDJPY and Williams volatility breakout also passed the test. Another strategy based on volatility compression: the Keltner Channel breakout.
Why 72 months?
The market changes fundamentally every 3–5 years: the participants and the volatility change, and trends give way to ranges. Gold is the best example. Until 2024 it spent long stretches in wide ranges, and a squeeze release often ended in a reversal: in training the robot earned 15% in four years. Then gold entered a strong trend, and the same logic gave 36% in two years. And in the spring of 2026 the market changed again: gold turned down and the robot went almost three months without trades. A 10–20 year test would have blended those eras into a single average figure. You have to choose a strategy for the current market, and change it when the market changes; that applies to this robot too.
That’s why I built my app “Find your strategy”, in the browser or on Telegram. There you can test any idea on up to 72 months of history, and every 2 weeks the app runs tens of thousands of strategies on its own and shows you the ones that work over the last 6, 12 and 36 months. It doesn’t promise profits: it helps you notice in time that the market has changed.
Backtest results on historical data do not guarantee future results.
Sources
- John F. Carter: “Mastering the Trade: Proven Techniques for Profiting from Intraday and Swing Trading Setups,” chapter on TTM Squeeze (Bollinger inside Keltner, momentum histogram).
- Own tests in MetaTrader 5 on the FxPro demo server, October 2026.
Where to trade
These are the brokers and exchanges I use that work with clients from Latin America. Always check that the service is available in your country, and start small.
Risk warning: CFDs, Forex and crypto derivatives carry a high risk of losing money due to leverage. This article is not investment advice.