Anyone who has ever opened a technical analysis book knows the double bottom: price hits the same level twice, turns around, and there is the “W,” a buy signal. You have seen it on the chart dozens of times, and maybe you have already entered a trade on it. I wanted to check how much this pattern really delivers. I programmed a robot with the classic rules and ran it on seven markets over 72 months. The answer came out honest, and it will save you time and deposit. At the end I show you which robots are better to use instead of chart patterns.
- With the classic rules, the pattern barely trades: on the daily chart, 4–11 trades in six years, with results from +2.1% to −8.9%. On H4 there are more trades, but 5 markets out of 7 end in a loss.
- Optimization did not find a stable version: on USDJPY H4 only 16 parameter sets out of 170 were profitable in training; on EURUSD H4, 13 out of 177.
- The best robot found returned +16.9% in 72 months, with just 42 trades. That is too few to tell a real edge from luck.
- What works better: the Heikin-Ashi robot on gold, +96% in 72 months with a 13.8% drawdown and +54% in the forward test.
📊 Download the Heikin-Ashi robot that actually works, for free
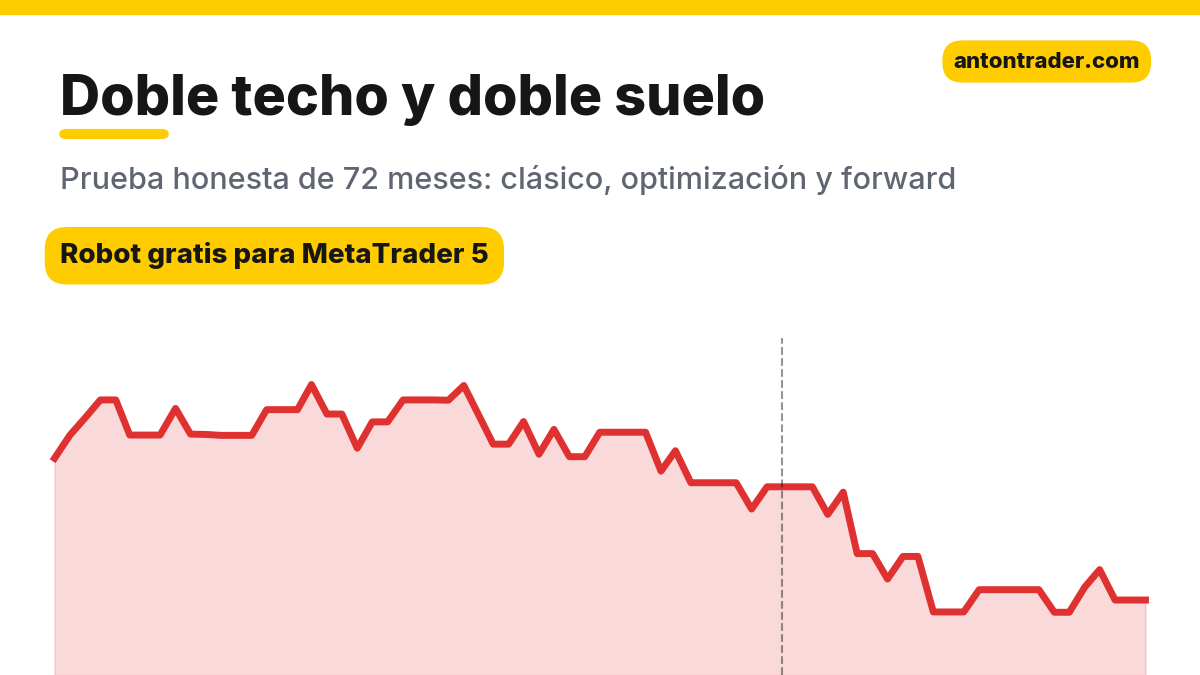
The strategy rules
The person who studied the double top and double bottom most thoroughly was Thomas Bulkowski: in his “Encyclopedia of Chart Patterns” he analyzed thousands of examples. The robot trades the pattern with the classic rules:
- Double bottom: two local lows at the same level, with a difference of no more than 0.5 ATR and at least 10 bars between them. The high between the two is the neckline. The height of the pattern must be at least 1 ATR.
- Entry: a candle closes above the neckline (no more than 20 bars after the second bottom). Buy at the open of the next candle. The double top is the mirror image: sell.
- Stop: behind the farthest bottom (or top), plus 0.2 ATR. Target: the height of the pattern, measured from the entry point.
- Risk of 1% of the balance per trade.
What it looks like on the chart
Below are two real trades by the robot on USDJPY H4, from the best optimized parameter set (double bottom only, take profit of 2.5 pattern heights). This is what the pattern looks like in real life: one time the neckline breakout is the start of the move, and another time it is a trap.
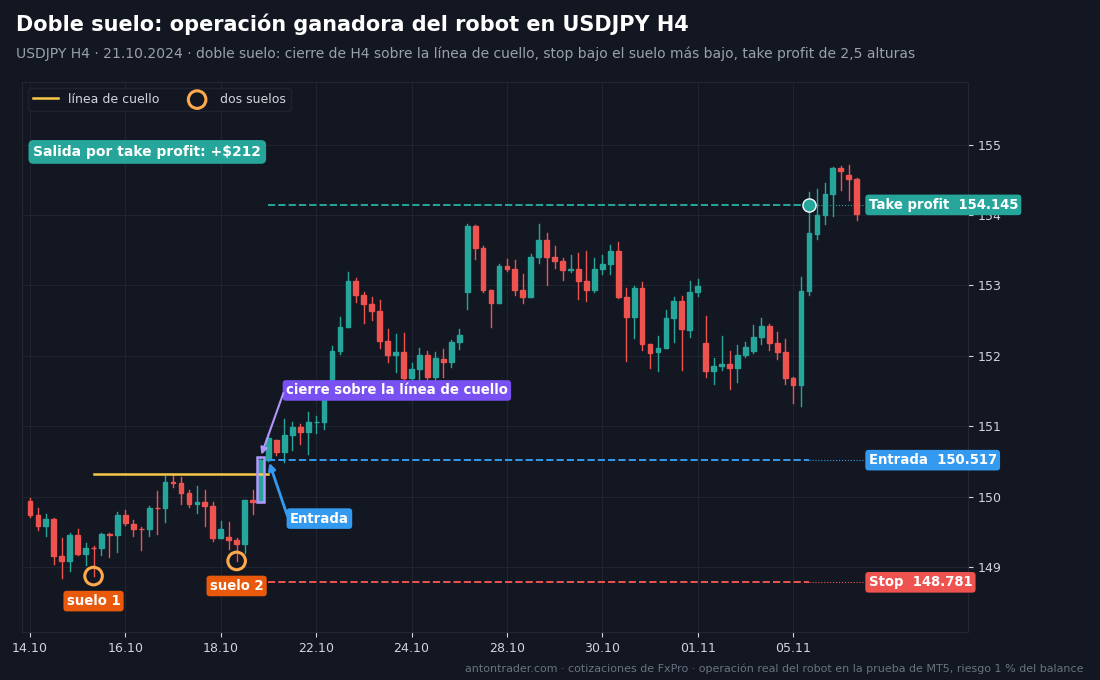
Winning trade. On October 16, 2024, USDJPY fell to 148.870, bounced, and on October 21 dropped again, to 149.085. Two bottoms at almost the same level, with the neckline between them at 150.321. That same day a four-hour candle closed above the neckline and the robot bought at 150.517. Stop below the lowest bottom, at 148.781; take profit of 2.5 pattern heights, at 154.145. The pair rose for two weeks and on November 6 reached the target: +$212.
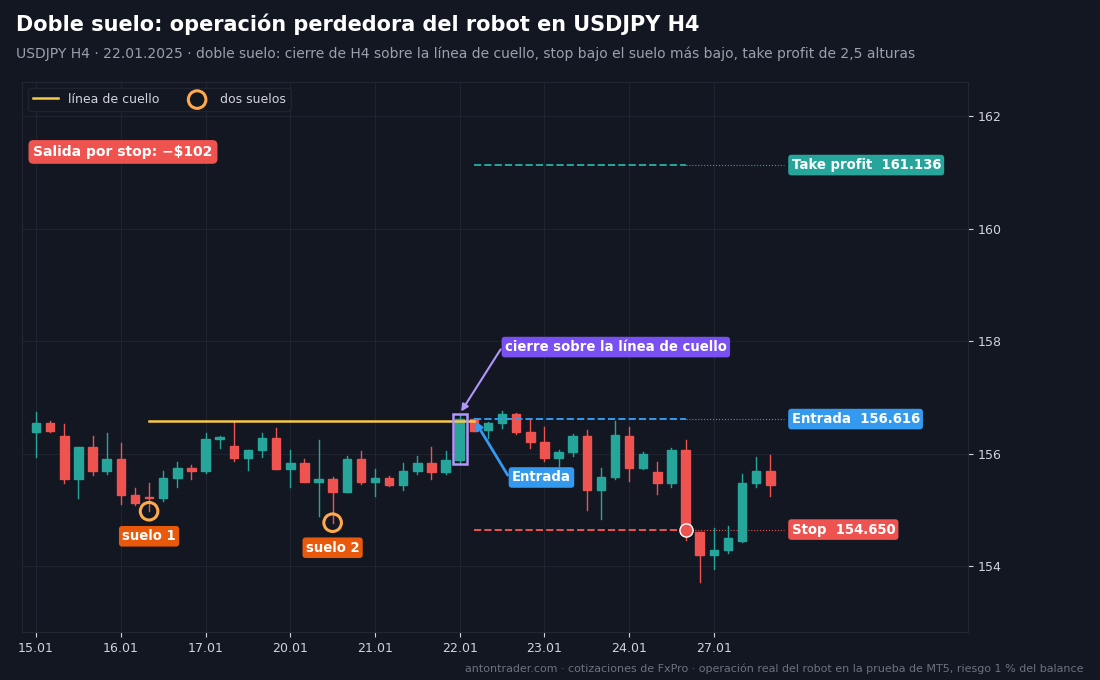
Losing trade. On January 17 and 21, 2025, two bottoms at 154.976 and 154.772, with the neckline at 156.580. On January 22 a candle closed above it, and the robot bought at 156.616, with a stop at 154.650 and take profit at 161.136. But the rally ended before it began: the pair went back below the neckline, and on January 27 it broke both bottoms and hit the stop: −$102. The pattern was “textbook,” and that shows well why the book does not guarantee the result.
By hand: on the H4 chart, look for two lows at roughly the same level with a bounce between them. Draw a horizontal line through the high between the two: that is the neckline. Buy only after a candle closes above the neckline; stop below the lowest bottom; target, the height of the pattern from the entry point (or more, if the market is in a strong trend).
How I ran the test
MetaTrader 5 Strategy Tester, a demo account at FxPro with its quotes, spreads, commissions and swaps. From October 2020 to October 2026, exactly 72 months. Deposit of $10,000, leverage 1:500, risk of 1% per trade, “1 minute OHLC” mode. Why exactly 72 months, I explain at the end of the article.
Double top and double bottom over 72 months: a pattern that barely exists
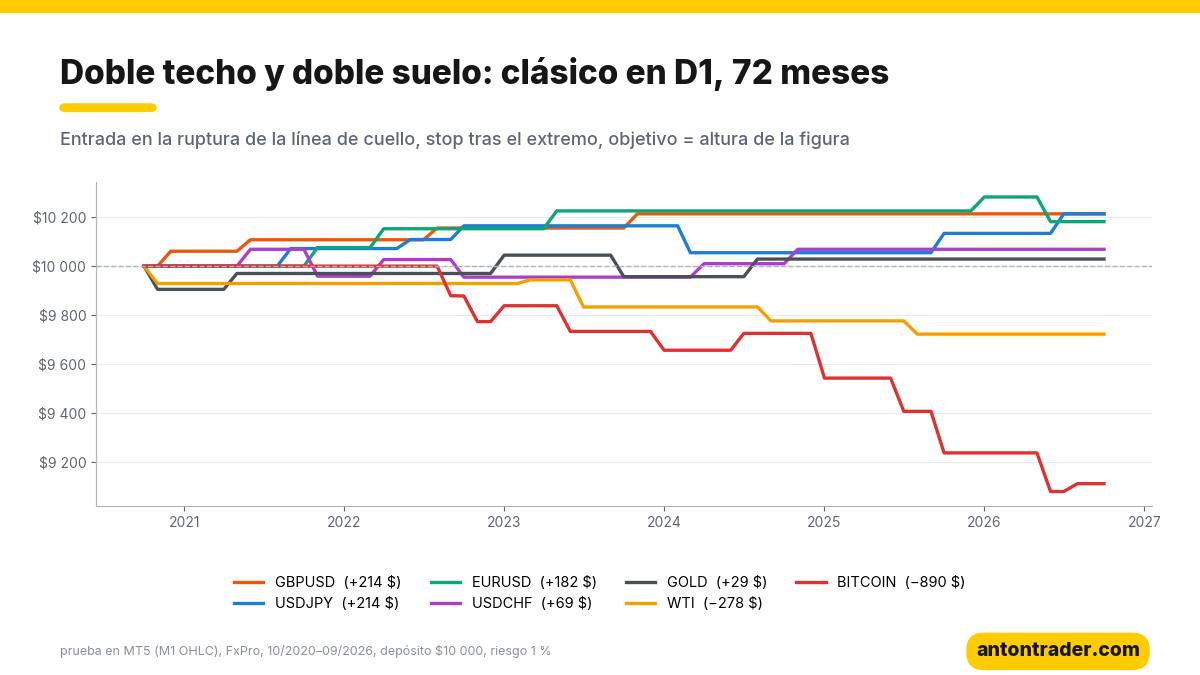
| Instrument | D1 result | D1 trades | H4 result | H4 trades |
|---|---|---|---|---|
| GBPUSD | +2.1% | 4 | −4.7% | 48 |
| USDJPY | +2.1% | 6 | −5.6% | 41 |
| EURUSD | +1.8% | 5 | +0.4% | 53 |
| USDCHF | +0.7% | 6 | −7.2% | 48 |
| GOLD | +0.3% | 5 | −8.1% | 43 |
| WTI (oil) | −2.8% | 5 | −2.0% | 48 |
| BITCOIN | −8.9% | 11 | +1.5% | 54 |
- A true pattern is rare. The strict rules (two bottoms at the same level, a clear neckline, a close beyond it) are met about once a year on the daily chart. A +2% across five markets means four to six trades, not a system.
- On H4 there are more patterns, but they are worse. Every small bounce draws a “W,” and the neckline breakout turns out false more often: five markets out of seven in a loss.
- Everyone sees the pattern. The stop below the double bottom is placed by anyone who learned from the same books, and price goes looking for it regularly, as in the losing example above.
What if optimization saves it?
I gave the optimizer freedom to choose everything: swing size, tolerance between bottoms, distance between them, pattern height, breakout wait time, target and direction, on USDJPY H4 and EURUSD H4, using only 10/2020–09/2024. Then I checked what it found on 10/2024–09/2026, months it had not seen.
- EURUSD H4: only 13 sets out of 177 were profitable in training. The best of them (+16% in four years) went to zero on new data: −0.2%.
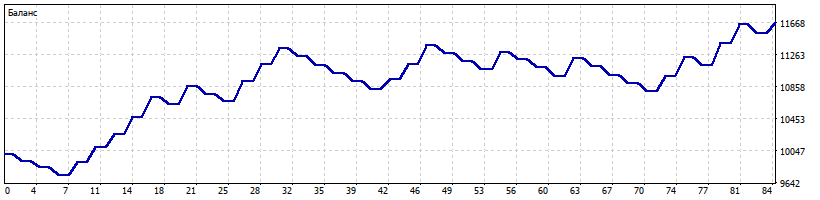
- USDJPY H4: the best set according to the forward test (double bottom only, take profit of 2.5 pattern heights) returned +10.8% in training and +5.5% in the forward test, with a profit factor of 1.62. Over 72 months, +16.9% with a 5.6% drawdown. But that is just 42 trades in six years, and out of 170 sets only 16 were profitable in training.
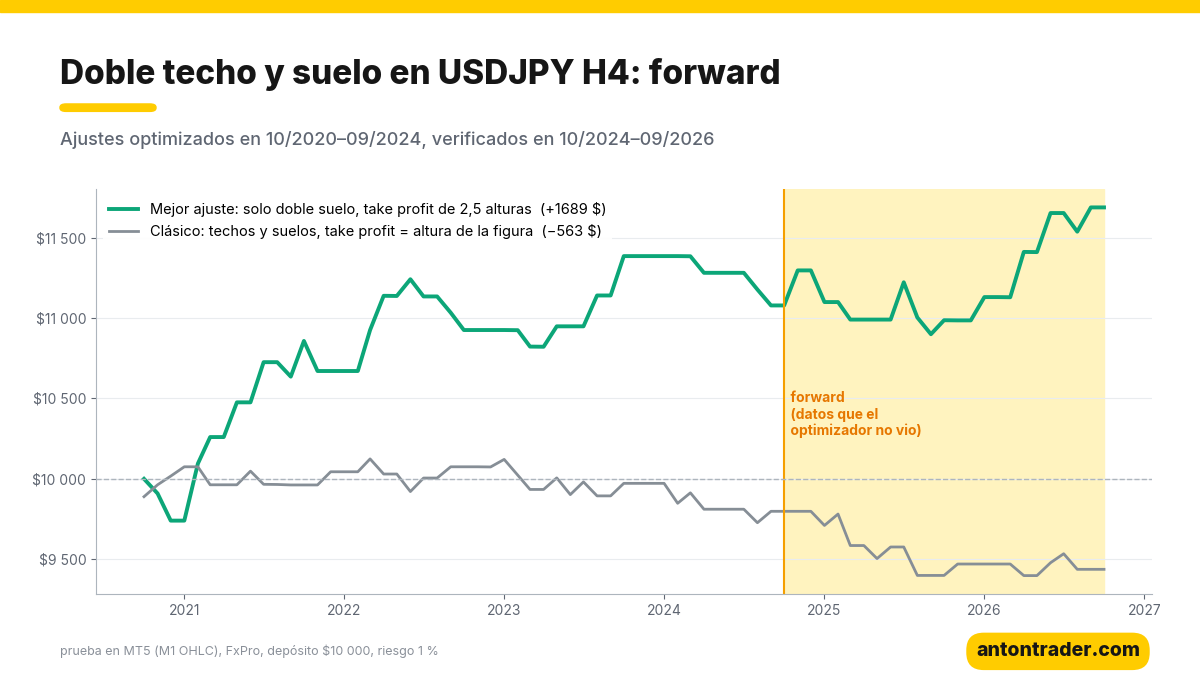
Formally, the USDJPY set passed the forward test. But when nine fits out of ten lose money and the one that survives makes seven trades a year, I cannot call it an edge: it looks more like a lucky sample. And even that positive result leans on the rise of the pair itself: the optimizer removed the sells and kept the USDJPY buys. If you want to profit in trending markets, there are more reliable ways; I show them below.
What to use instead of chart patterns: robots that passed the test
In the same 72-month test, these robots held up under verification on new data, and they have far more trades, so their results are more reliable:
| Robot | Over 72 months | Max. drawdown | Forward 10/2024–09/2026 |
|---|---|---|---|
| Heikin-Ashi, GOLD H4 | +96.4% | 13.8% | +54.4%, profit factor 1.71 |
| Supertrend, USDJPY H4 | +40.2% | 4.8% | +11.3%, profit factor 2.24 |
| Williams volatility breakout, USDJPY D1 | +42.8% | 6.5% | +14.2%, profit factor 1.56 |
| For comparison: double bottom, USDJPY H4 (best fit) | +16.9% | 5.6% | +5.5%, profit factor 1.62 |
All three trade the same thing the double bottom tries to capture: the end of a pullback in the direction of the main move. But they do not enter on a pattern that everyone draws their own way; they enter on a clear rule that triggers dozens of times a year. That is why their result is not a lucky sample but statistics.
📊 Download the Heikin-Ashi robot for gold
📊 Download the Supertrend robot for USDJPY
Where to run them and how to download them
The robots work on MetaTrader 5 with any broker that offers gold and USDJPY. My test was done at FxPro. The other brokers in my ranking also work: RoboForex and Tickmill. The robots are free for clients of these brokers:
- Open a MetaTrader 5 account with one of the brokers above (or use the one you already have).
- Go to the Telegram bot with the button and send your account number.
- After verification, the bot sends you the file: the robot, ready-made parameters and instructions. Run it in your broker’s tester (it takes an afternoon) and put it into operation.
If you want to experiment with the patterns yourself, the bot also has the “Double Top and Double Bottom” robot, with the classic and the optimized parameters. But I would not put it on a real account.
My conclusion
The double top and double bottom are a useful marker: they show where the crowd expects the reversal and where their stops will be. But as a standalone system, the pattern does not work. With strict rules it barely appears; with flexible rules it falls into false breakouts too often, and optimization on two markets gave either zero or a handful of trades you cannot trust. Protect your deposit: if you want to buy the end of a pullback, do it with a rule verified over hundreds of trades; Heikin-Ashi on gold and Supertrend on USDJPY confirmed it.
Earlier, pivot trading and the breakout of the first London hour also failed the test: there, too, you trade levels that everyone sees. Other analyses: the inside bar breakout, Bollinger Bands and Elder’s Triple Screen.
Why 72 months?
The market changes fundamentally every 3–5 years: the participants and the volatility change, and trends give way to ranges. Chart patterns were described in an era when charts were drawn by hand and few people noticed the same “W.” Today any scanner finds it in a second, and beneath every double bottom there are thousands of identical stops. Even within these six years the picture changed: on USDJPY the classic on H4 was losing slowly until the fall of 2024, and in the forward test the losses accelerated. A 10–20 year test would have blended those markets into a single average figure. A strategy has to be chosen for the current market, and changed when the market changes.
To search for strategies like these I built my app “Find Your Strategy”, in the browser or on Telegram. It includes patterns and levels: you can test any idea on up to 72 months of history, and every 2 weeks the app automatically runs tens of thousands of strategies and shows you the ones that work over the last 6, 12 and 36 months. It does not promise profits: it helps you tell a living idea from a pretty textbook picture.
Backtest results do not guarantee future results.
Sources
- Thomas N. Bulkowski: “Encyclopedia of Chart Patterns”; double top and double bottom, neckline, target based on pattern height.
- My own tests on MetaTrader 5 on the FxPro demo server, October 2026.
Where to trade
These are the brokers and exchanges I use that work with clients from Latin America. Always check that the service is available in your country and start small.
Risk warning: CFDs, Forex and crypto derivatives carry a high risk of losing money due to leverage. This article is not investment advice.