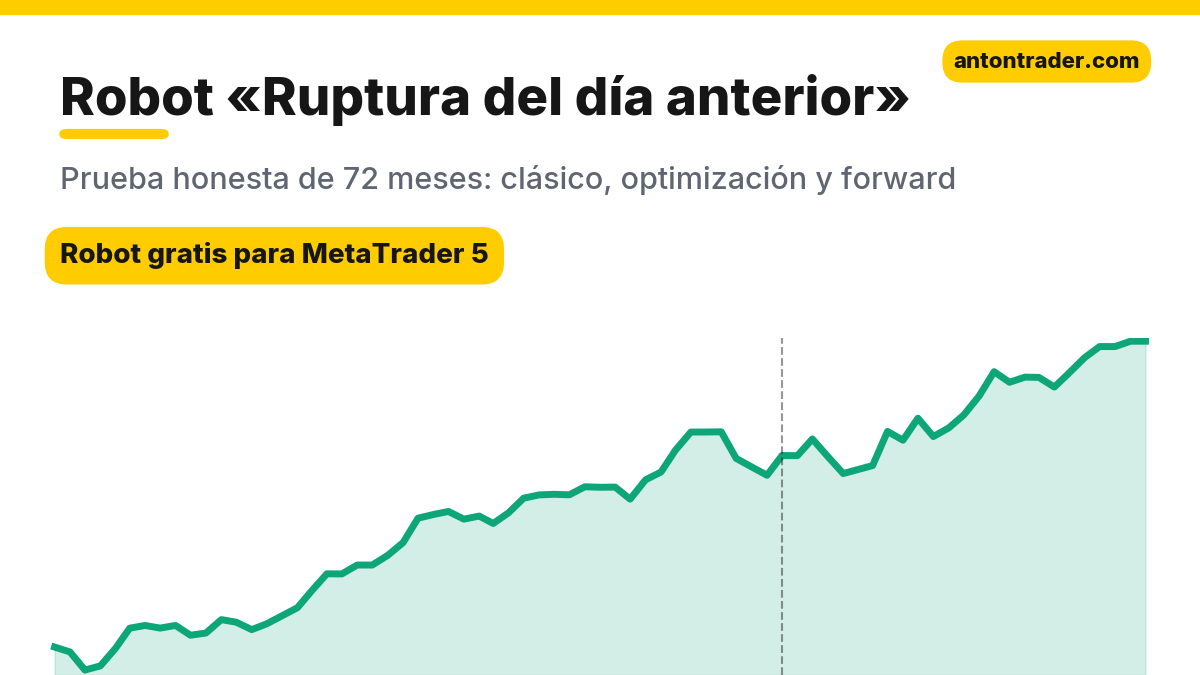
Everyone sees yesterday’s high: it’s marked on the chart, and behind it sit the sellers’ stops and the buyers’ pending orders. When the price breaks it, someone was wrong, and the market moves. One of the oldest strategies was built on this simple idea: the breakout of the previous day’s high or low. I tested it on seven markets over 72 months and found a version that held up through two years of data the optimizer never saw. It’s a robot for USDJPY on H1. I’ll show you what it did, what its trades look like, where its risks are, and how to download it for free.
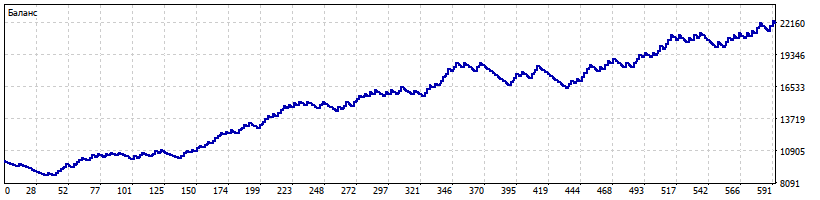
- +120.8% in 72 months on USDJPY H1, risking 1% per trade. Maximum drawdown: 13.6%.
- +32.8% in the forward test (10/2024–09/2026) with a profit factor of 1.49: the robot made money on data it didn’t see during tuning.
- Risking 2% per trade, the same robot gave +366% in 72 months with a 25.5% drawdown.
- In the archive: the robot for MetaTrader 5, the .set file for USDJPY H1, and the instructions. It takes 5 minutes to get running.
📊 Download the “Previous Day Breakout” robot for free on Telegram
What the robot does
The breakout of the previous day’s extremes is the shortest version of Richard Donchian’s channel breakout: a one-day channel. The rule is repeated in day trading books and forums: if the price exceeds yesterday’s high, you buy; if it drops below yesterday’s low, you sell; the stop goes at the middle of yesterday’s range and you exit at the end of the day. The robot takes that idea and removes what made it lose money in the historical data:
- Level: yesterday’s high plus a small margin (0.05 of the daily ATR), so it doesn’t enter on a mere touch.
- Entry: a buy at the moment of the breakout, only from 05:00 to 14:00 server time (FxPro: UTC+2, UTC+3 in summer). One trade per day.
- Long-only. On USDJPY the robot doesn’t open sells on a breakout of the low.
- Stop: at the middle of yesterday’s range. Take profit: two stops. The trade is not closed at the end of the day: it is closed by the stop or the take profit, sometimes several days later.
- Position size: based on risk as a % of the balance. In the test, 1%; in the parameters you can set your own.
It’s a trend-continuation robot: it enters in the direction the market has already gone and doesn’t try to guess the reversal. It closes 43% of its trades in profit, but each winning trade earns twice what a losing one costs.
What it looks like on the chart
Below are two real trades by the robot in the USDJPY H1 test. Both are from the forward period, which the optimizer didn’t see: one winner and one loser, so you can see the robot as it really is. Yesterday is shown in gray; the purple lines are its high and low.
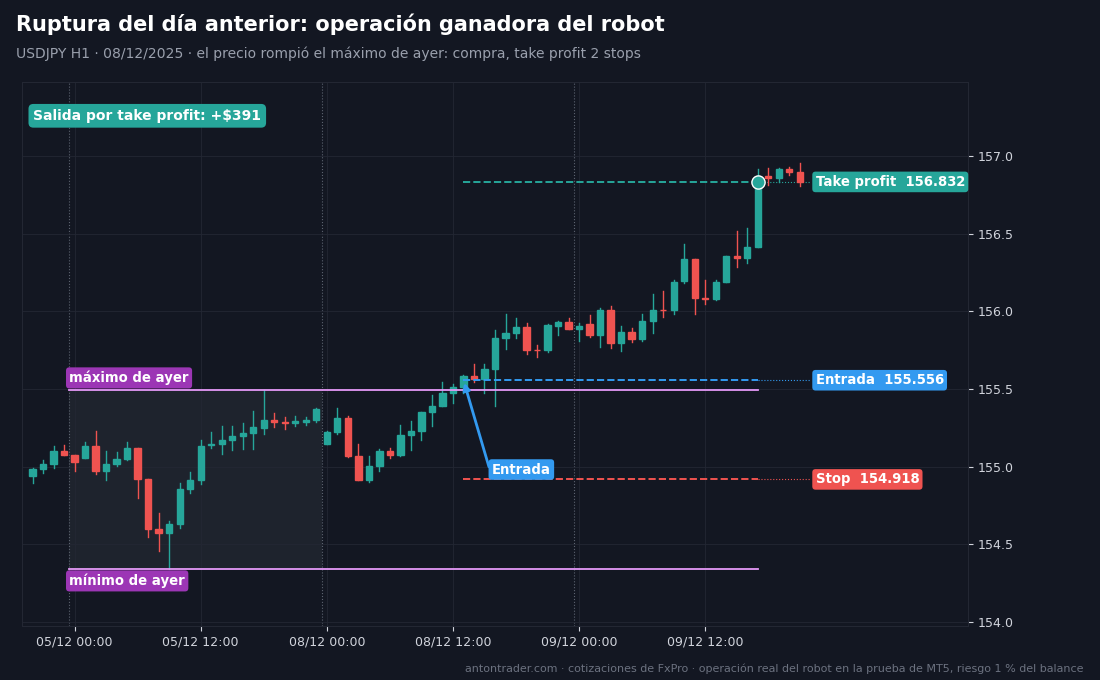
Winning trade. On Monday, December 8, 2025, USDJPY rose above Friday’s high. The robot bought at 155.556, with the stop at 154.918, at the middle of Friday’s range. The breakout was real: the next day the pair reached the take profit at 156.832: +$391.
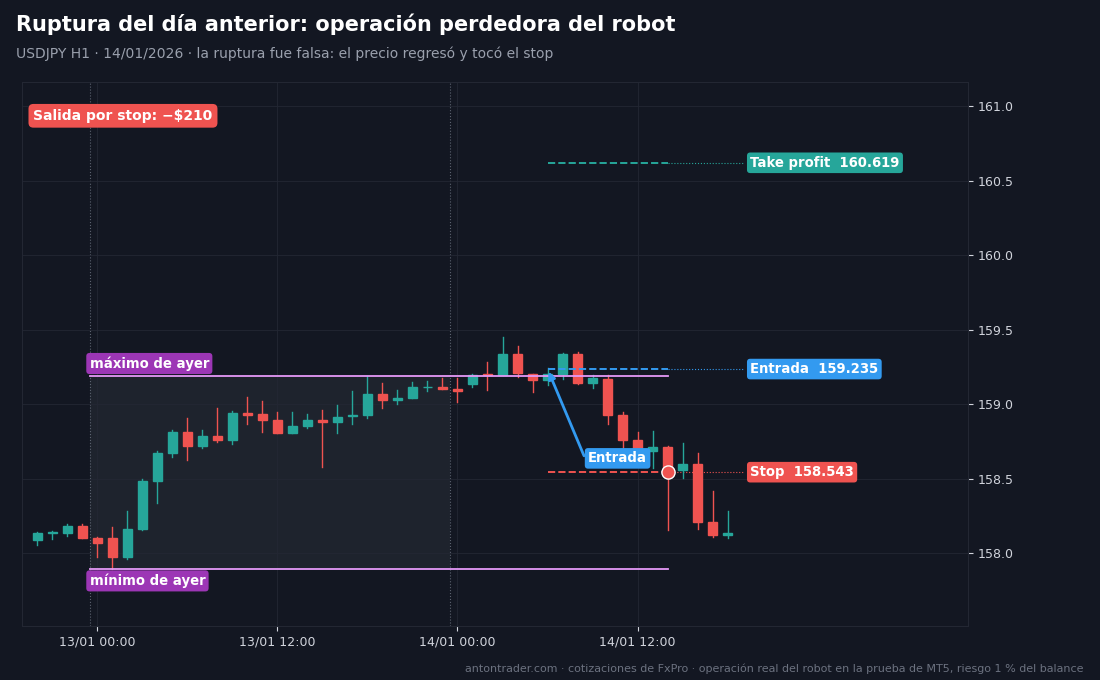
Losing trade. On January 14, 2026 the setup was the same: in the morning the price exceeded yesterday’s high and the robot bought at 159.235, with the stop at 158.543. But the breakout was false: the buyers didn’t hold the level, and a few hours later the price went back into the range and hit the stop: −$210. Trades like this are a normal part of the job: the loss is half of a typical win.
Manually: open USDJPY on H1 and mark yesterday’s high and low. From 05:00 to 14:00 server time, wait for the price to move above yesterday’s high by a small margin. Buy, with the stop at the middle of yesterday’s range and the take profit at twice the stop distance. One trade per day and no sells.
Robot results: training and forward
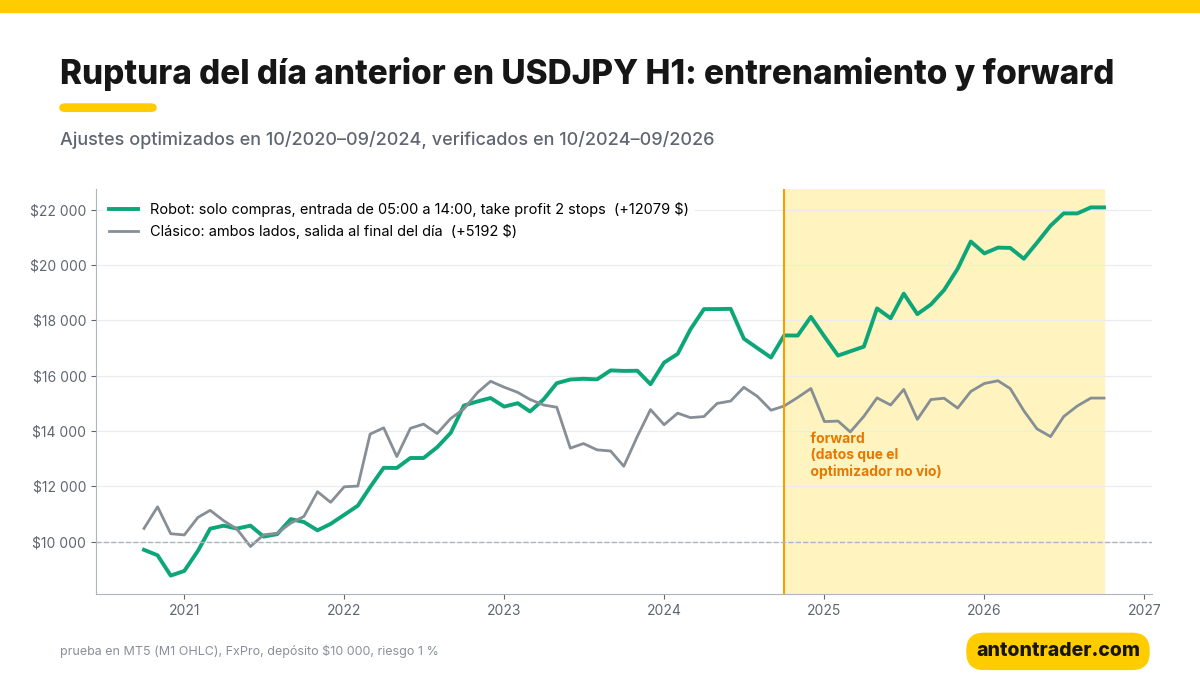
To avoid fooling myself with overfitting, I split the history into two parts. The parameters are chosen only with 10/2020–09/2024. Then the robot takes the exam on 10/2024–09/2026, months the optimizer didn’t see. The test: MetaTrader 5 strategy tester, a FxPro demo account with its quotes, spreads, commissions and swaps, a $10,000 deposit, 1:500 leverage, “1 minute OHLC” mode.
| Period (USDJPY H1) | Return | Profit factor | Max. drawdown | Trades |
|---|---|---|---|---|
| Training, 10/2020–09/2024 | +66.9% | 1.46 | 13.6% | 194 |
| Forward, 10/2024–09/2026 | +32.8% | 1.49 | 12.8% | 102 |
| All 72 months, 1% risk | +120.8% | 1.47 | 13.6% | 295 |
| All 72 months, 2% risk | +366.1% | 1.44 | 25.5% | 295 |
| Longest pause without a new high | ≈ 14 months (05/2024–07/2025) |
The most important thing here is the forward test. On unknown data, the profit factor didn’t fall but rose slightly, from 1.46 to 1.49, and the drawdown stayed the same. And it’s not just one lucky combination of numbers: of 113 profitable sets in training, 79 also won in the forward test, and the neighboring set (the same one, but without the margin over the high) gave +35.7% in the forward test with a profit factor of 1.45. I’ll be frank with you about the money: over 72 months, commissions took $802, and the swaps on USDJPY buys at FxPro were positive in the test and added up to $1,406. The robot often holds a trade from one night to several days, and with the current rate differential that is paid to the buyer. If rates converge, that bonus will disappear.
📊 Download the robot and the parameters for USDJPY H1
Why the “internet” previous day breakout doesn’t work and this one does
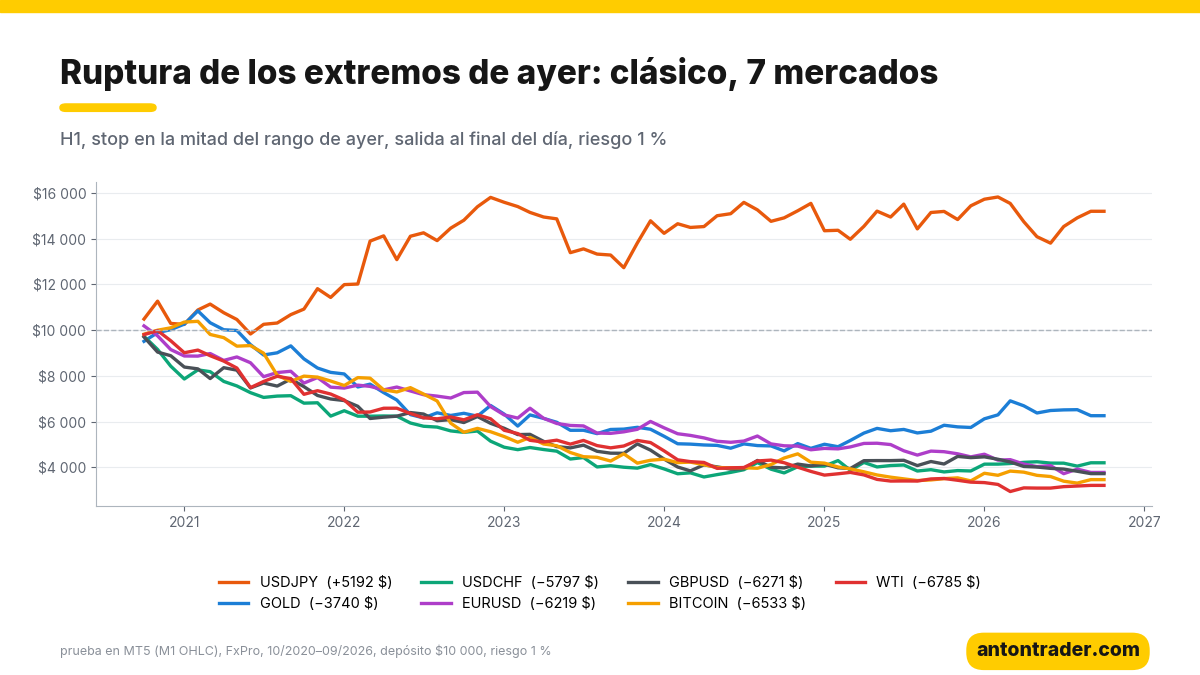
First I ran the strategy the way it’s usually described: H1, breakout of yesterday’s high to buy and of the low to sell, stop at the middle of yesterday’s range, exit at the end of the day. Buys and sells, seven markets, 72 months:
| Instrument (H1) | Result | Profit factor | Max. drawdown | Trades |
|---|---|---|---|---|
| USDJPY | +51.9% | 1.07 | 25.6% | 1,249 |
| GOLD | −37.4% | 0.89 | 58.1% | 1,219 |
| USDCHF | −58.0% | 0.80 | 65.2% | 1,266 |
| EURUSD | −62.2% | 0.82 | 65.9% | 1,271 |
| GBPUSD | −62.7% | 0.79 | 63.3% | 1,276 |
| BITCOIN | −65.3% | 0.82 | 70.5% | 1,527 |
| WTI (oil) | −67.9% | 0.75 | 72.1% | 1,262 |
Six of the seven markets lost between a third and two thirds of the deposit. There are three reasons:
- One trade every day. The classic trades any breakout: in a range, at night, before the news. Most of those breakouts are false, and each one is paid for with the full stop, the spread and the commission.
- Both sides, including against the trend. In a market that rises for years, sells on a breakout of the low almost always catch a pullback, not the start of a decline.
- Exit at the end of the day. A real breakout often continues tomorrow and the day after, and the classic closes it in the afternoon, with a small piece of the move.
The robot that works differs in exactly that: long-only in a market with a clear trend, entry only in the first half of the day, a take profit of two stops and no afternoon close. The idea itself, entering when the price has passed yesterday’s high, stayed the same. The robot is configured only for USDJPY H1, and I don’t recommend taking it to other markets without your own test: the classic showed that, without a trend, this breakout doesn’t work.
The risks, with no makeup
- Long pauses. From May 2024 to July 2025 the robot’s balance didn’t mark a new high: about 14 months. The maximum equity drawdown over the 72 months was 13.6%. It’s wise to prepare for that patience in advance.
- Stop streaks. From December 2024 to March 2025, when the yen strengthened sharply, the robot had 11 stops in a row: about −11% of the balance. There was an equal streak in the summer of 2024. It wins 43% of its trades, so streaks of 4 to 6 stops are normal.
- The robot only buys USDJPY. It wins as long as the pair is generally rising. If the Bank of Japan strengthens the yen for a long time, buying breakouts will start to lose. The swap bonus also depends on the rate differential.
- A 2% risk also doubles the drawdown: 25.5% instead of 13.6%. I would start with 1% and raise the risk only after seeing the robot work live with you.
Where to run the robot
The robot works on MetaTrader 5 with any broker that offers USDJPY. My test was done at FxPro. The other brokers in my ranking also work: RoboForex and Tickmill. Before putting it on your account, run it in your broker’s tester: it takes an afternoon and shows you how it behaves with your quotes, spreads and swaps. Keep the server time in mind: the parameters are calculated for the FxPro server (UTC+2, UTC+3 in summer); if your broker has a different time, shift StartHour and EndHour. To make it work without pauses, leave the platform on a VPS: the robot has to see every breakout at the moment it happens.
Download the “Previous Day Breakout” robot for free
The robot is free for clients of the brokers in my ranking:
- Open a MetaTrader 5 account with one of the brokers above (or use the one you already have).
- Go to the Telegram bot with the button and send your account number.
- After verification, the bot sends you the file: the robot, the parameters for USDJPY H1, the classic parameters for your own experiments, and the instructions.
📊 Download the “Previous Day Breakout” robot for free on Telegram
My conclusion
The previous day breakout in its classic form is a correct idea with poor discipline: it trades every day, in both directions, and closes trades before the breakout has time to prove itself. If you trade only with the trend, only during active hours, and give the profit twice the room of the loss, you get a robot that doubled the deposit on USDJPY in 72 months with a 13.6% drawdown, and that in two unknown years gained 32.8% with a profit factor of 1.49. The forward test confirmed it, and the neighboring settings behaved the same way; that’s why I trust this robot. But remember: it bets on USDJPY rising and knows how to sit still for a long time. Take care of your deposit: start on demo and with a small risk.
Today I also published the analysis of Tom DeMark’s TD Sequential. There the test ended differently. On USDJPY, Raschke’s “Holy Grail” and Supertrend also passed the test. Other breakout strategies: Larry Williams’ volatility breakout, the London first-hour breakout and Crabel’s NR7.
Why 72 months?
The market changes fundamentally every 3–5 years: the participants and the volatility change, and trends give way to ranges. USDJPY is a good example. From 2021 to 2024 the pair rose almost without pauses, and breakouts to the upside worked. At the start of 2025 the yen strengthened sharply, and the same robot had a streak of stops. A 10–20 year test would have blended those eras into a single average figure. A strategy has to be chosen for the current market, and changed when the market changes; that applies to this robot too: if USDJPY enters a long decline, it needs to be stopped.
That’s why I made my app “Find Your Strategy”, in the browser or on Telegram. There you can test any idea on a history of up to 72 months, and every 2 weeks the app automatically runs tens of thousands of strategies and shows you the ones that work over the last 6, 12 and 36 months. It doesn’t promise profits: it helps you notice in time that the market has changed.
Backtest results do not guarantee future results.
Sources
- Richard Donchian: price channel breakout rule (N-day channel; the previous day breakout is the case N = 1).
- Curtis M. Faith: “Way of the Turtle” (McGraw-Hill, 2007), Donchian channel breakouts in trading systems.
- Own tests in MetaTrader 5 on the FxPro demo server, November 2026.
Where to trade
These are the brokers and exchanges I use that work with clients from Latin America. Always check that the service is available in your country and start small.
Risk warning: CFDs, Forex and crypto derivatives carry a high risk of losing money due to leverage. This article is not investment advice.