Nine candles in a row down. It looks like the sellers got tired and the reversal is about to begin; you just have to catch the moment. That is exactly what Tom DeMark’s TD Sequential promises: count to nine and the market is “exhausted.” The indicator is on almost every platform, and its numbers from 1 to 9 over the candles are shown in channels and forums as ready-made signals. I wrote a robot with DeMark’s rules and ran it on seven markets over 72 months. I’ll show you what came out and which robot is better to use instead.
- The classic doesn’t work. The setup 9 on D1 over 72 months: the best market was oil, with +3.9% in six years. On EURUSD, −23.0%; on USDJPY, −13.7%. On GOLD H4 the same rules lost 33.0% with a drawdown of 50.4%.
- The reason: the “nine” is a bet against the trend. The robot buys after the ninth consecutive lower close, and a strong trend often goes well beyond nine candles.
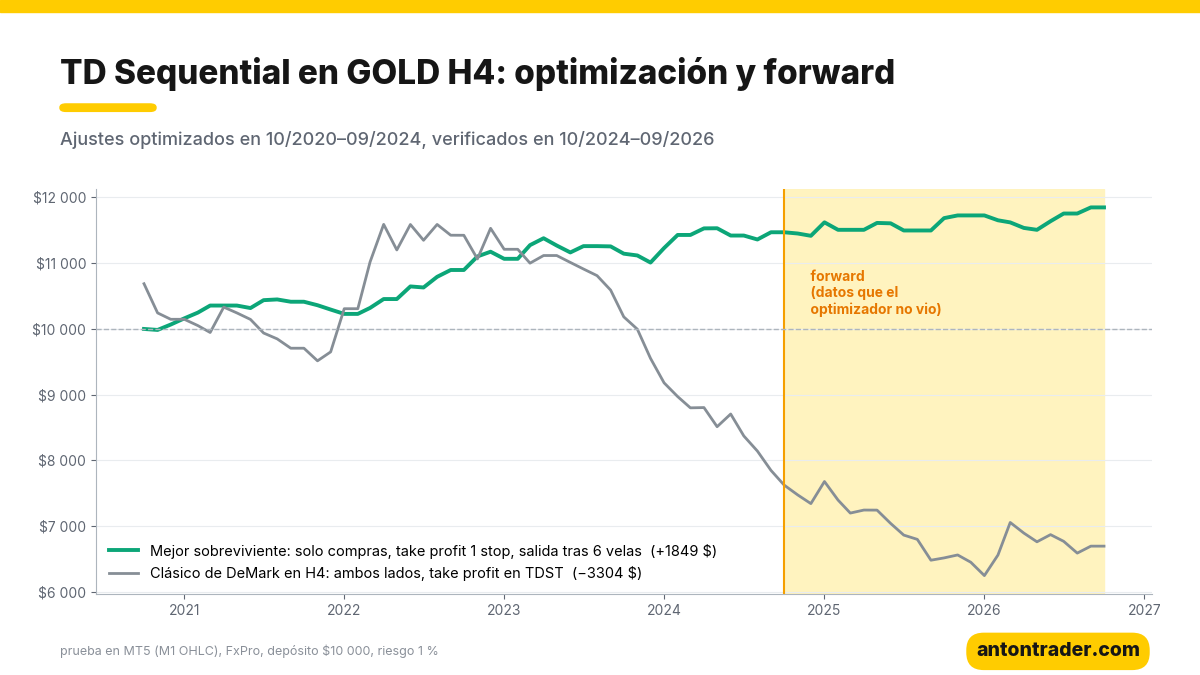
- Optimization didn’t save it: on GOLD H4, of 23 profitable sets in training, only 9 stayed positive in the forward test. The best survivor earned barely +3.4% over two unseen years.
- What works better: the robot that trades the breakout of yesterday’s high. Equally simple rules, but with the move instead of against it: +120.8% over 72 months on USDJPY with a drawdown of 13.6%, and +32.8% in the forward test with a profit factor of 1.49.
📊 Download the “Previous Day Breakout” robot for free, the one that does work
The strategy rules
TD Sequential was described by Tom DeMark in the book “The New Science of Technical Analysis” (1994); Jason Perl explains the rules in detail in “DeMark Indicators” (2008). The idea: every move has an “exhaustion” limit, and it can be counted by the closes. The first part of the indicator is the setup 9, which is what gets traded the most:
- Change in price direction: first a close above the close 4 candles earlier, and then the market turns down (for buys).
- Buy setup: 9 consecutive closes below the close 4 candles earlier. The count resets if a single close breaks the condition.
- “Perfect” setup: the low of candle 8 or 9 is not above the lows of candles 6 and 7. DeMark considered these setups more reliable.
- Entry: after the close of candle 9, against the move: buy after nine lower closes, sell after nine higher ones.
- Stop: behind the extreme of the setup. Target: the TDST level, the opposite edge of the setup (for a buy, its high).
- Position size: based on a risk of 1% of the balance per trade.
The second part of the indicator, the 13 count (countdown), I didn’t touch in this test: in articles and forums, what gets traded is the “nine.”
What it looks like on the chart
Below are two real trades from the robot, from the best set the optimizer found on GOLD H4, both from the forward period. The purple box marks the setup, the numbers are DeMark’s count, and the dotted yellow line is the TDST level.
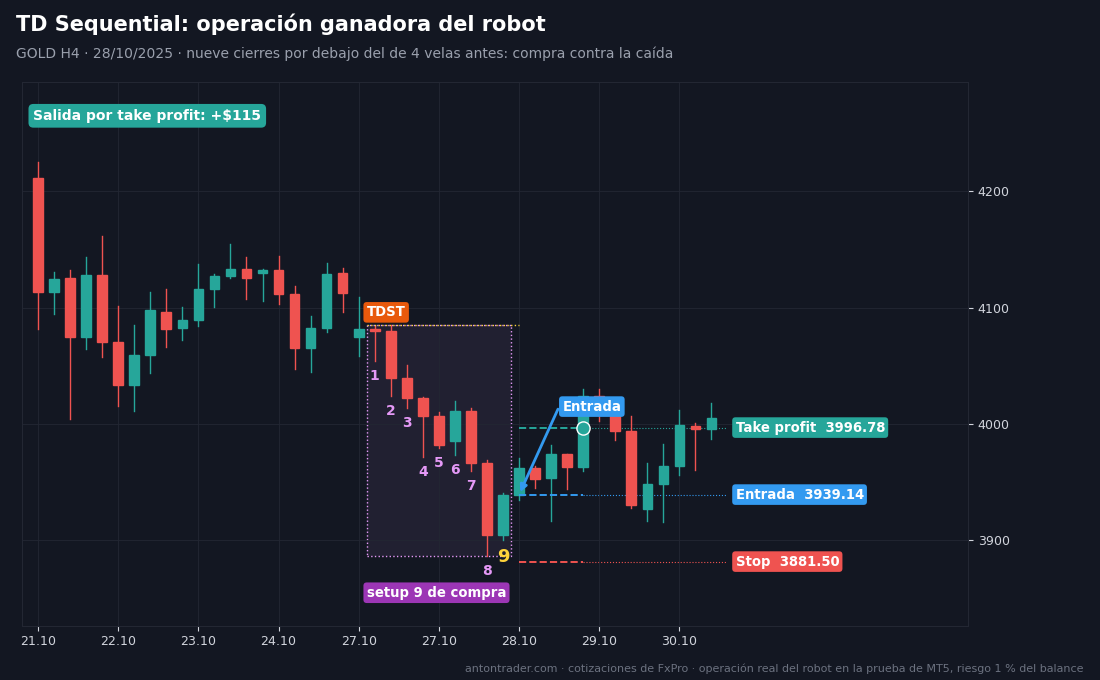
The trade many people like the strategy for. On October 28, 2025, gold closed for the ninth consecutive time below the close from four candles earlier. The robot bought at 3,939.14, with a stop at 3,881.50. The sellers really had run out of steam: the next day the price reached the take profit at 3,996.78: +$115.
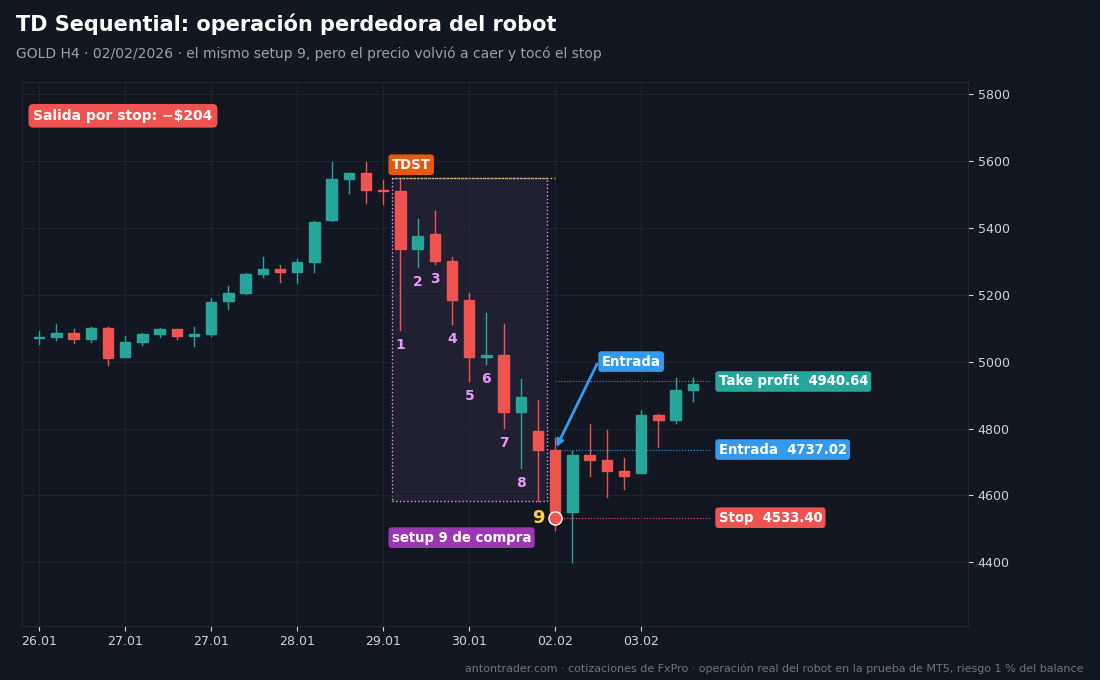
The trade that wipes out those wins. From January 30 to February 2, 2026, gold was falling from 5,500 dollars, and the count reached nine again. The robot bought at 4,737.02, with a stop at 4,533.40. But the “exhausted” drop made another leg down and hit the stop: −$204. The reversal came, but without the robot by then. You can’t tell these two pictures apart in advance: at the moment of entry they look the same.
By hand it looks like this: turn on the TD Sequential indicator (or count yourself: compare each close with the close 4 candles earlier). When a 9 appears over a candle, you buy against the drop, put the stop below the low of the setup and wait for the bounce. It looks nice in the history, when you already know where the drop ended.
How I ran the test
MetaTrader 5 Strategy Tester, FxPro demo account with its quotes, spreads, commissions and swaps. Period: October 2020 to October 2026, 72 months. Deposit of $10,000, leverage 1:500, “1 minute OHLC” mode. Why exactly 72 months, I’ll tell you at the end of the article.
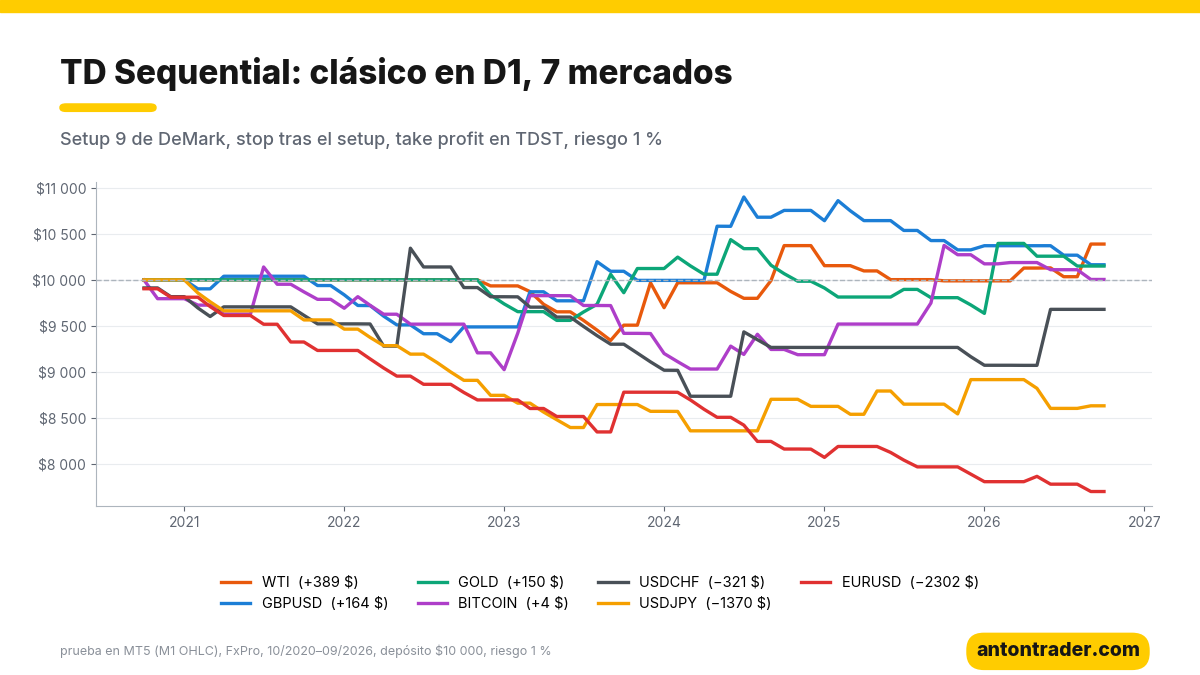
TD Sequential over 72 months: no clear positive result in any market
| Instrument (D1) | Result | Profit factor | Max. drawdown | Winning trades |
|---|---|---|---|---|
| WTI (oil) | +3.9% | 1.22 | 7.9% | 31% |
| GBPUSD | +1.6% | 1.07 | 9.8% | 27% |
| GOLD | +1.5% | 1.07 | 9.8% | 27% |
| BITCOIN | 0.0% | 1.00 | 14.6% | 23% |
| USDCHF | −3.2% | 0.89 | 16.4% | 15% |
| USDJPY | −13.7% | 0.50 | 18.0% | 18% |
| EURUSD | −23.0% | 0.21 | 25.6% | 8% |
Over six years on daily charts there were 26 to 43 trades per market, and even the best result is under 1% a year. There are three reasons:
- Trading against the trend. Nine consecutive closes in one direction are, precisely, a trend. A strong move easily goes past the ninth candle, and the robot buys a falling knife.
- A stop too close to the price. The ninth candle usually closes near the edge of the setup, so the stop ends up a few pips from the entry. One more push in the direction of the trend and the trade is closed.
- A target too far away. The price rarely reaches the TDST level, the opposite edge of the setup. Between 8% and 31% of trades closed in profit, and the infrequent wins don’t cover the streaks of stops.
On GOLD H4 the same rules give signals more often and lose faster: −33.0% over 72 months, a drawdown of 50.4% and 17% winning trades.
What if optimization saves it?
I gave the optimizer freedom: “perfect” setups or any, take profit at the TDST or 1 to 3 stops, stop no smaller than 0.5–1.5 ATR, exit after 6 or 12 candles, close on the opposite setup, trend filter with EMA 100 or 200, buys only or both sides. The market: GOLD H4, because on dailies the classic has few trades, and gold had the strongest pullbacks in these years. The optimization was done only on 10/2020–09/2024, and afterward I checked what it found on 10/2024–09/2026, months the optimizer never saw.
- Of 23 profitable sets in training, only 9 stayed positive in the forward test. The rest “worked” only on the data they were fitted to.
- The best set in training (+25.0%) lost 8.7% in the forward test.
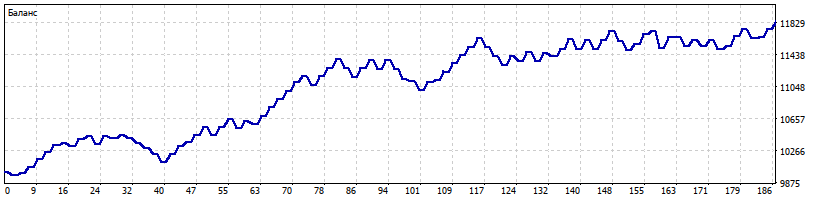
- The best survivor (any setup 9, buys only, stop no smaller than 1 ATR, take profit at 1 stop, exit after 6 candles): +14.7% in training with a profit factor of 1.75, and +3.4% over two years of forward testing with a profit factor of 1.34. Over the full 72 months, +18.5% with a drawdown of 5.7%.
A drawdown of 5.7% looks calm, but I don’t recommend this set. First, +3.4% over two years is under 2% a year: a slightly larger spread at another broker eats it up. Second, the neighboring sets with the same key rules are mostly negative in the forward test: it’s a lucky combination of numbers, not a stable edge. And third, this is no longer DeMark’s TD Sequential: “gold buys only” in the years when gold more than doubled is a bet on the trend, not on the “exhaustion” of the move.
What to use instead of TD Sequential: robots that passed the test
If you like simple rules you can see on the chart, use a robot that trades with the move instead of against it, or robots that withstood verification on data the optimizer didn’t see:
| Robot | Over 72 months | Max. drawdown | Forward 10/2024–09/2026 |
|---|---|---|---|
| Breakout of yesterday’s high, USDJPY H1 | +120.8% | 13.6% | +32.8%, profit factor 1.49 |
| Raschke’s “80-20,” GOLD H4 | +74.2% | 17.1% | +24.8%, profit factor 1.84 |
| “Holy Grail,” USDJPY H4 | +69.3% | 8.7% | +20.7%, profit factor 2.39 |
| For comparison: classic TD Sequential (7 markets, D1) | from +3.9% to −23.0% | up to 25.6% | — |
📊 Download the “Previous Day Breakout” robot for USDJPY
📊 Download the “Holy Grail” robot for USDJPY
Where to run them and how to download them
The robots work in MetaTrader 5 with any broker. My test was done at FxPro. The other brokers in my ranking also work: RoboForex and Tickmill. The robots are free for clients of these brokers:
- Open a MetaTrader 5 account with one of the brokers above (or use the one you already have).
- Go to the Telegram bot with the button and send your account number.
- After verification, the bot sends you the file: the robot, the ready-made parameters and the instructions. Run it in your broker’s tester, it takes you an afternoon, and put it live.
If you want to check DeMark’s count yourself, the bot also has the TD Sequential robot, with the classic and the optimized parameters, to experiment with in the tester. It’s not a good idea to put it on a real account.
My conclusion
TD Sequential looks great in other people’s screenshots: a 9 and then the reversal. But the history shows something else: the 9 shows up both at the start of a reversal and in the middle of a strong trend, and you can’t tell them apart in advance. The classic didn’t win clearly in any market over 72 months, and optimization only found one set that gave +3.4% over two unseen years. Protect your deposit: buying the “exhaustion” of a strong move is standing in its way. To trade, use a robot that has passed the test, for example the breakout of yesterday’s high: it enters with the move and over 72 months it doubled the deposit on USDJPY.
Today I also published the analysis of the previous day breakout robot. Other reversal strategies I tested: Turtle Soup, the double top and double bottom and the grid and martingale did not pass the test. In contrast, Raschke’s “80-20”, a reversal within the trend, did pass it on gold.
Why 72 months?
The market changes fundamentally every 3–5 years: the participants and the volatility change, and trends give way to ranges. That’s why I don’t run 10–20 year tests: they mix different markets into a single average figure, and after the market changes, the strategy has to be changed anyway. TD Sequential is a clear example. DeMark created it in the 70s and 80s for markets where moves ran out of steam more often. In 2020–2026 gold rose for years and the yen fell, and the “nine” against those trends turned out to be a trap again and again. You have to trade the market that exists today.
To search for strategies for the current market I built my app “Find Your Strategy”, in the browser or in Telegram. There you can test any idea on a history of up to 72 months, and every 2 weeks the app runs tens of thousands of strategies on its own and shows you the ones that work over the last 6, 12 and 36 months. It doesn’t promise profits: it helps you notice in time that the market has changed and that an old idea has stopped working.
Backtest results do not guarantee future results.
Sources
- Thomas R. DeMark: “The New Science of Technical Analysis” (John Wiley & Sons, 1994), TD Sequential, the setup 9 and the TDST level.
- Jason Perl: “DeMark Indicators” (Bloomberg Press, 2008), rules of the setup, the “perfect” setup and the 13 count.
- Own tests in MetaTrader 5 on the FxPro demo server, November 2026.
Where to trade
These are the brokers and exchanges I use that work with clients from Latin America. Always check that the service is available in your country and start small.
Risk warning: CFDs, Forex and crypto derivatives carry a high risk of losing money due to leverage. This article is not investment advice.