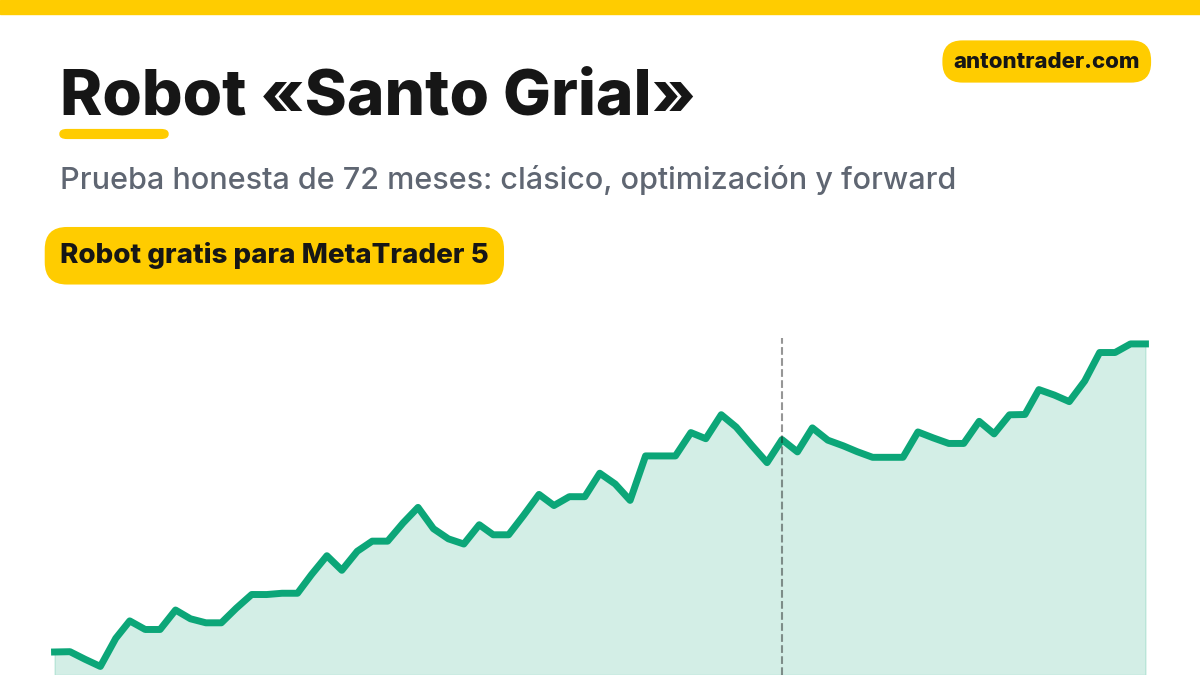
“Holy Grail” is a loud name for a trading system. Linda Raschke gave it to her strategy with irony: there is no grail in the market, but there is a simple idea that works more often than others: enter a strong trend not at the peak, but on the pullback. I tested her rules on seven markets over 72 months and found a version that held up through two years of data the optimizer never saw. It is a robot for USDJPY on H4. I’ll show you what it did, what its trades look like, where its risks are, and how to download it for free.
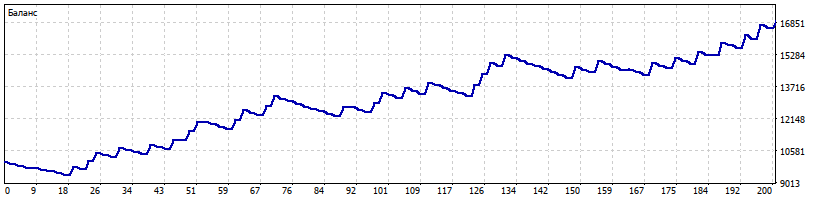
- +69% in 72 months on USDJPY H4, risking 1% per trade. Maximum drawdown: 8.7%.
- +21% in the forward test (10/2024–09/2026) with a profit factor of 2.39: the robot made money on data it did not see during tuning.
- Risking 2% per trade, the same robot returned +181% in 72 months with a 17.2% drawdown.
- In the archive: the robot for MetaTrader 5, the .set file for USDJPY H4, and the instructions. You can get it running in 5 minutes.
📊 Download the free robot on Telegram
What the robot does
The “Holy Grail” strategy was described by Linda Bradford Raschke and Laurence Connors in the book “Street Smarts” (1995). Its logic is simple. The ADX indicator measures trend strength: if it is above 30 and rising, the market is moving decisively in one direction. In such a trend, the price occasionally pulls back to the 20 EMA, and that is where late buyers get a good price. Raschke places a pending buy order slightly above the high of the candle that touched the average, with the stop below the low of the pullback. If the trend continues, the order triggers on its own. The robot works like this:
- Strong trend: on H4, the ADX(14) rose above 20 in at least one of the last 15 candles, and the +DI line is above the −DI.
- Pullback: a candle touched the EMA 30 with its low. The robot places a pending buy order slightly above its high. If the price does not rise on the next candle, the order is deleted.
- Stop: below the low of the last 7 candles. Take profit: four stops. When the trade gains two stops, the stop moves to breakeven.
- Buy only: on USDJPY the robot does not open sell trades.
- Position size: based on risk as a % of the balance. In the test, 1%; in the parameters you can set your own.
It is a trend-following robot with a distant target: it takes small stops frequently and makes its money on the infrequent trades where the trend continued and the price reached a take profit four times larger than the stop. It closes 36% of trades in profit, and that is enough, because one winning trade covers four losing ones.
What it looks like on the chart
Below are two real trades from the robot in the USDJPY H4 test. Both are from the forward period, which the optimizer did not see: one winner and one loser, so you can see the robot as it really is. At the top are the candles and the EMA 30 (yellow line); the circle marks the touch of the average. At the bottom, the ADX (white line), +DI and −DI; the dotted line is the level 20.
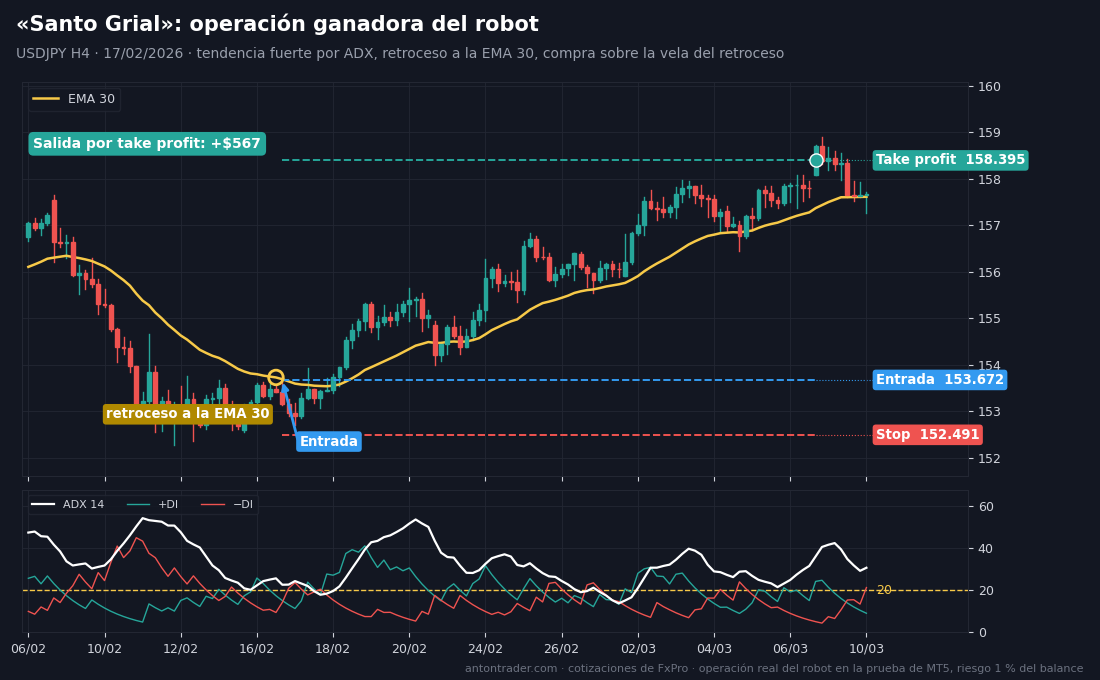
Winning trade. In mid-February 2026 USDJPY pulled back to the EMA 30, and before that the ADX had risen above 20: the trend was strong. The robot placed a buy order above the pullback candle, and on February 17 the order triggered at 153.672. Stop at 152.491, below the low of the last seven candles. Take profit at 158.395, four times farther than the stop. The price rose for three weeks and on March 9 reached the target: +$567.
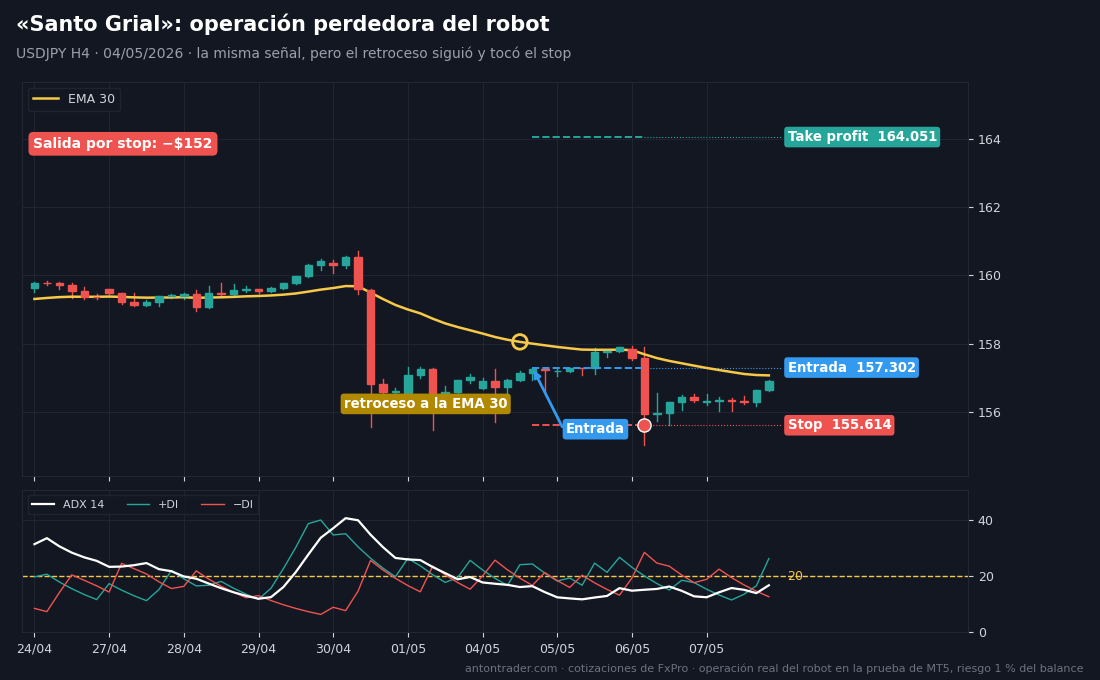
Losing trade. In early May 2026 the setup was similar: a pullback to the EMA 30 in a strong trend. On May 4 the robot bought at 157.302, with a stop at 155.614 and a take profit at 164.054. But the pullback was not over: two days later the price dropped further and hit the stop: −$152. This is what most of this robot’s trades look like: a small loss, after which it waits for the next pullback. One trade that reaches the take profit pays back four stops like this one.
Manually: open the USDJPY chart on H4 and add an EMA 30 and the ADX(14) indicator with the +DI and −DI lines. Wait for the ADX to rise above 20 and the +DI to be above the −DI. When a candle touches the EMA 30, place a Buy Stop order slightly above its high. Stop below the low of the last seven candles; take profit at four times that distance. If the order does not trigger on the next candle, delete it. Once you are up two stops, move the stop to breakeven.
Robot results: training and forward
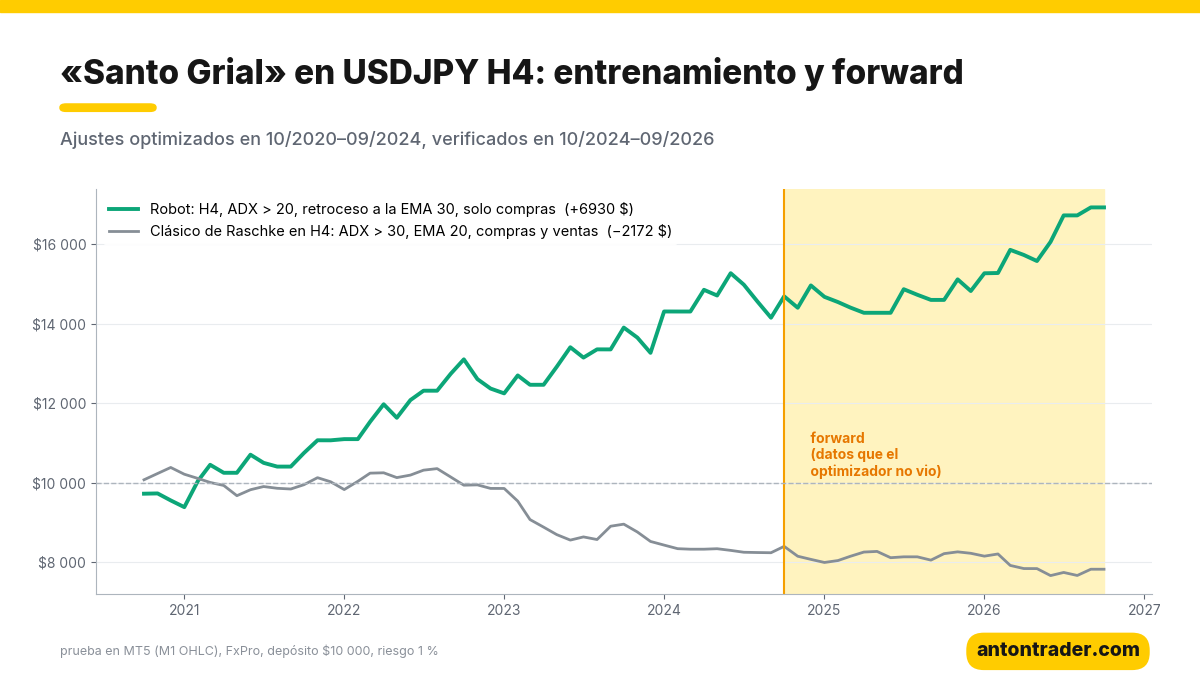
To avoid fooling myself with overfitting, I split the history into two parts. The parameters are chosen using only 10/2020–09/2024. Then the robot takes the exam on 10/2024–09/2026, months the optimizer did not see. The test: MetaTrader 5 strategy tester, a FxPro demo account with its quotes, spreads, commissions and swaps, $10,000 deposit, 1:500 leverage, “1 minute OHLC” mode.
| Period (USDJPY H4) | Return | Profit factor | Max. drawdown | Trades |
|---|---|---|---|---|
| Training, 10/2020–09/2024 | +43.8% | 1.77 | 8.7% | 74 |
| Forward, 10/2024–09/2026 | +20.7% | 2.39 | 4.7% | 26 |
| All 72 months, 1% risk | +69.3% | 1.87 | 8.7% | 100 |
| All 72 months, 2% risk | +181.4% | 1.84 | 17.2% | 100 |
| Longest pause without a new high | ≈ 20 months (06/2024–03/2026) |
The most important part here is the forward test. On unseen data, the profit factor rose from 1.77 to 2.39, and the drawdown was smaller than in training. And it is not just one lucky combination of numbers: of 119 profitable sets in training, 114 stayed positive in the forward test, and neighboring settings (EMA from 10–40, take profit of 2.5–4 stops, ADX from 15 to 35) also make money. I’ll be frank about the money: over 72 months commissions took $126, and the swaps on USDJPY buys at FxPro added $1,103, roughly a sixth of the profit. The robot holds a trade for several weeks on average, and the positive swap from buying dollar against yen works in its favor.
📊 Download the robot and the parameters for USDJPY H4
Why the “internet” “Holy Grail” doesn’t work and this one does
First I ran the strategy exactly as Raschke and Connors describe it: daily chart, ADX(14) above 30 and rising, pullback to the EMA 20, order above the pullback candle, stop below the low of the last five candles, take profit at the previous 20-candle high, buys and sells. Seven markets, 72 months:
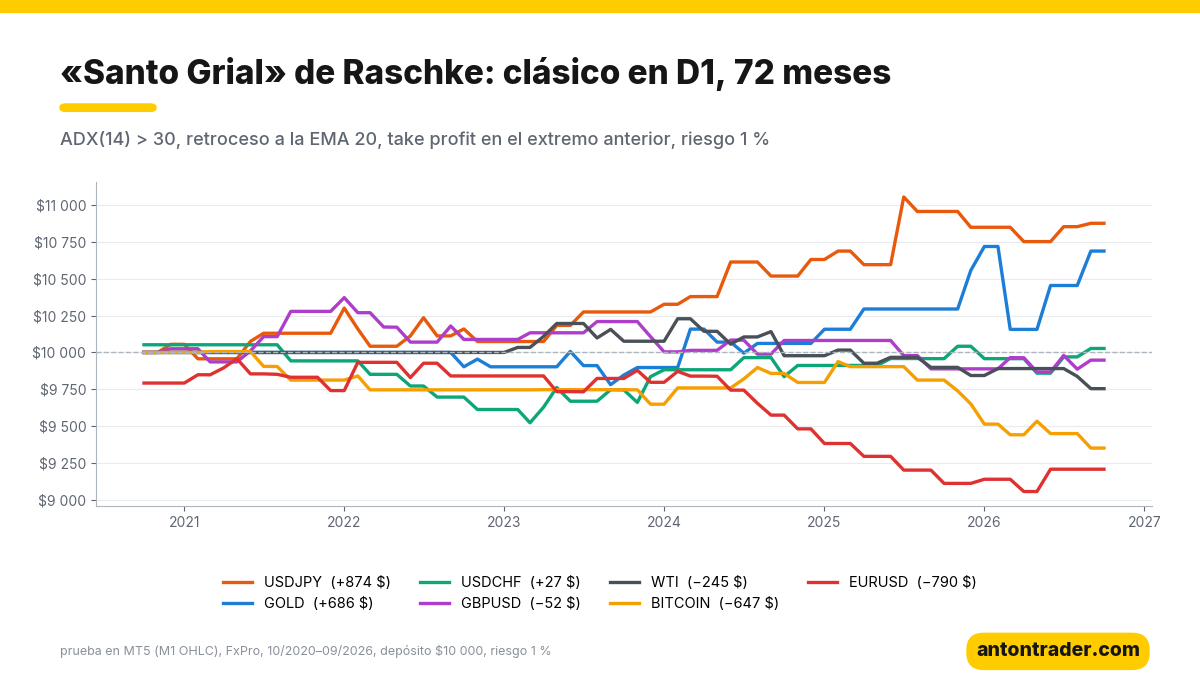
| Instrument (D1) | Result | Profit factor | Max. drawdown | Trades |
|---|---|---|---|---|
| USDJPY | +8.7% | 1.83 | 4.0% | 27 |
| GOLD | +6.9% | 1.62 | 10.0% | 20 |
| USDCHF | +0.3% | 1.03 | 5.4% | 24 |
| GBPUSD | −0.5% | 0.96 | 5.6% | 28 |
| WTI (oil) | −2.5% | 0.72 | 5.2% | 22 |
| BITCOIN | −6.5% | 0.57 | 7.7% | 27 |
| EURUSD | −7.9% | 0.60 | 10.0% | 36 |
A clear positive only on USDJPY and gold; on the other markets, close to zero or a loss. There are three reasons:
- Too few trades. On the daily chart, an ADX above 30 is not frequent, and a pullback to the average at that moment is even less so. Over six years that is 20–36 trades, and the result is decided by a few good or bad moves.
- The target is too close. A take profit at the previous high works in a range, but in a strong trend the price is already near the highs: there is very little left to the target, and the stop below the pullback is wide. Of the strongest moves, the classic captures only a little.
- Sells against the main move. In these years USDJPY rose from 105 to 160, and the classic sold every downward pullback whenever the ADX was high.
The robot that works differs in exactly these points: H4 instead of D1, to get more trades; ADX above 20 instead of 30, to catch the trend earlier; a take profit of four stops instead of the previous high; and buys only. Raschke’s idea, strong trend, pullback to the average and entry above the pullback candle, stayed the same. For comparison: the classic parameters on the same USDJPY H4 lost 21.7% in 72 months with a 29% drawdown. On gold H4 the optimization was not stable: of 90 profitable sets in training, only 50 stayed positive in the forward test. That is why the robot is configured only for USDJPY H4, and I don’t recommend taking it to other markets without your own test.
The risks, with no makeup
- Long pauses. From late June 2024 to March 2026 the robot’s balance did not set a new high: about 20 months. The drawdown was small, but the wait was long. It’s worth preparing for that patience in advance.
- Streaks of stops are normal. It wins 36% of trades, so five to seven stops in a row are a regular part of the job. Choose a risk level you can sit through calmly.
- The robot only buys USDJPY, and today the swaps on buys are positive. If US and Japanese rates converge, the swap will shrink or turn negative, and in a long decline of the pair the robot will hit its stop more often.
- A 2% risk also doubles the drawdown: 17.2% instead of 8.7%. I would start with 1% and raise the risk only after seeing the robot work live with you.
Where to run the robot
The robot works on MetaTrader 5 with any broker that offers USDJPY. My test was done at FxPro. The other brokers in my ranking also work: RoboForex and Tickmill. Before putting it on your account, run it in your broker’s tester: it takes an afternoon and shows you how it behaves with your quotes and your swaps. To keep it running without interruption, leave the platform on a VPS: the robot has to see the close of every H4 candle and place and delete pending orders on time.
Download the “Holy Grail” robot for free
The robot is free for clients of the brokers in my ranking:
- Open a MetaTrader 5 account with one of the brokers above (or use the one you already have).
- Go to the Telegram bot with the button and send your account number.
- After verification, the bot sends you the file: the robot, the parameters for USDJPY H4, Raschke’s classic parameters for your own experiments, and the instructions.
📊 Download the free robot on Telegram
My conclusion
The “Holy Grail” in its classic form is a good idea with an awkward target: on the daily chart it trades little and squeezes too little out of a strong trend. But Raschke’s idea, entering a strong trend on the pullback with a clear stop below the pullback, works on USDJPY. If you give the trend more room, keep only the buys, and move to H4, you get a robot that earned 69% in 72 months with an 8.7% drawdown, and that earned 21% over two unseen years with a profit factor of 2.39. The forward test confirmed it, and almost all neighboring settings behaved the same way; that is why I trust this robot. But remember the pauses: it knows how to sit still for a long time. Protect your deposit: start on a demo account and with a small risk.
Today I also published the analysis of Linda Raschke’s Turtle Soup, her other famous strategy, based on false breakouts. There the test ended differently. These also passed the test: TTM Squeeze on gold, Heikin-Ashi on gold and Supertrend on USDJPY. Another strategy with ADX: Parabolic SAR + ADX.
Why 72 months?
The market changes fundamentally every 3–5 years: the participants and the volatility change, and trends give way to ranges. USDJPY is a good example. From 2021 to mid-2024 the pair rose most of the time, and buying pullbacks made money one after another. Then came the interventions and sharp reversals, and the same robot went almost two years without setting a new high, although it ended the forward test in positive territory. A 10–20 year test would have blended those eras into a single average figure. A strategy should be chosen for the current market, and changed when the market changes; that applies to this robot too.
That is why I built my app “Find your strategy”, in the browser or on Telegram. There you can test any idea on up to 72 months of history, and every 2 weeks the app automatically runs tens of thousands of strategies and shows you the ones that work over the last 6, 12 and 36 months. It does not promise profits: it helps you notice in time that the market has changed.
Backtest results do not guarantee future results.
Sources
- Linda Bradford Raschke and Laurence A. Connors: “Street Smarts: High Probability Short-Term Trading Strategies” (M. Gordon Publishing, 1995), chapter “The Holy Grail” (ADX above 30, pullback to the EMA 20, entry above the pullback candle).
- J. Welles Wilder: “New Concepts in Technical Trading Systems” (1978): the ADX, +DI and −DI indicators.
- Own tests in MetaTrader 5 on the FxPro demo server, October 2026.
Where to trade
These are the brokers and exchanges I use that work with clients from Latin America. Always check that the service is available in your country and start small.
Risk warning: CFDs, Forex and crypto derivatives carry a high risk of losing money due to leverage. This article is not investment advice.