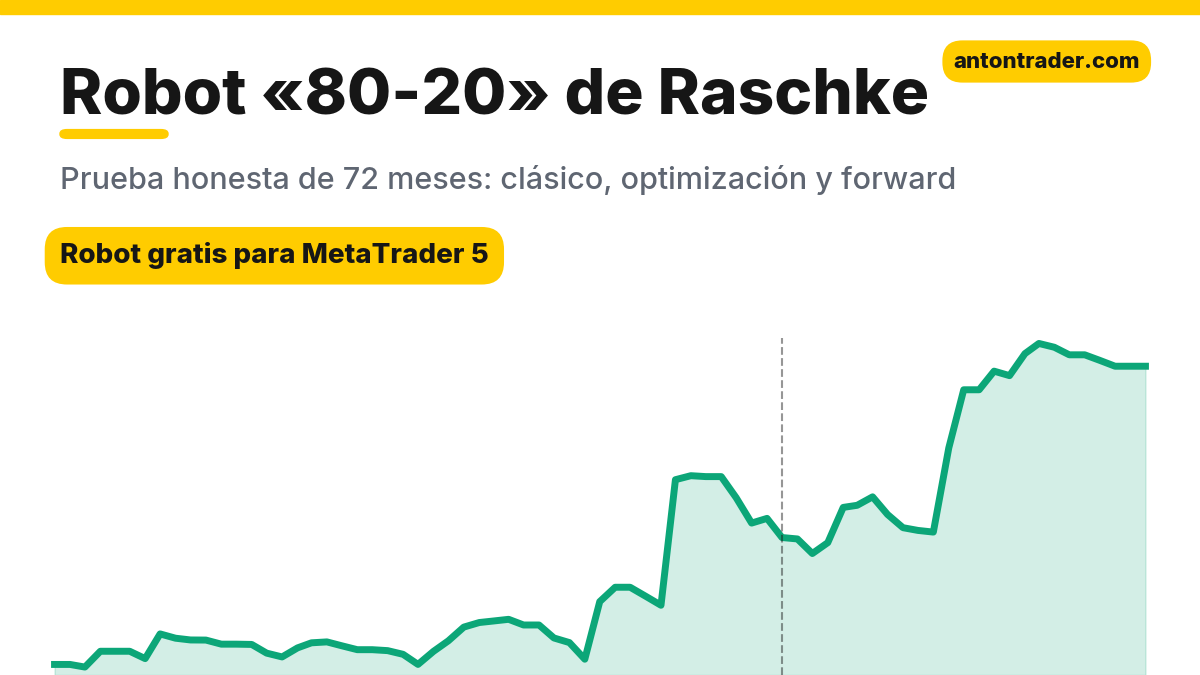
Price opened at the very top of the candle and closed at the very bottom. It looks like a defeat for the buyers, and at that moment most traders sell. Linda Raschke noticed that after a candle like that the market usually makes one more push down… and then immediately comes back. She called this pattern “80-20.” I tested it on seven markets over 72 months and found a version that held up on two years of data the optimizer never saw. It is a robot for gold on H4. I’ll show you what it did, what its trades look like, where its risks are, and how to download it for free.
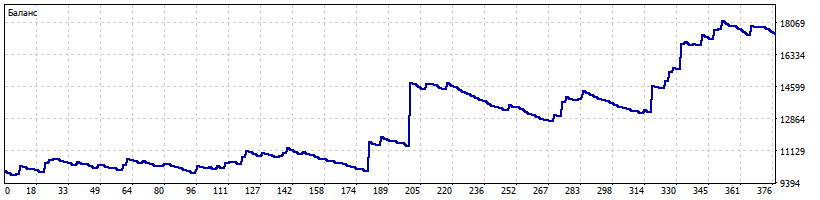
- +74% in 72 months on GOLD H4, risking 1% per trade. Maximum drawdown: 17.1%.
- +25% forward (10/2024–09/2026) with a profit factor of 1.84: the robot made money on data it did not see during the tuning.
- Risking 2% per trade, the same robot returned +173% in 72 months with a 31.8% drawdown.
- In the file: the robot for MetaTrader 5, the .set for GOLD H4, and the instructions. It takes 5 minutes to get running.
📊 Download the “80-20” robot for free on Telegram
What the robot does
The “80-20” pattern was described by Linda Bradford Raschke and Laurence Connors in the book “Street Smarts” (1995). The rule is simple. Yesterday’s candle opened in the top 20% of its range and closed in the bottom 20%: sellers pushed the price down all day. Today the market drops even lower than yesterday’s low, takes out the buyers’ stops, and attracts those who sell “the breakout.” If after that the price returns to yesterday’s low, Raschke buys: the sellers have run out of strength. The stop goes below the day’s low. In the book it is a short trade, lasting a few hours; sells are the mirror image. The robot works like this:
- Signal candle: on H4, a candle opened in the top 20% of its range and closed in the bottom 20%.
- Entry: the next candle drops below the low of the signal candle and returns to it. At that moment the robot buys.
- Trend filter: it only buys when the price is above the EMA 100. On gold the robot does not open sells.
- Stop: below the low of the entry candle, but never less than 0.9 ATR away. After that the stop moves up below the low of the last 6 candles. There is no take profit: the trade is closed by the trailing stop.
- Position size: based on risk as a % of the balance. In the test, 1%; in the parameters you can set your own.
It is a pullback robot that trades within the trend: it buys gold after a sharp candle down, when the sellers are already exhausted. Most trades close with a small stop, and the money comes from the infrequent trades where, after the pullback, a new wave up begins and the trailing stop follows it for several days. 28% of trades close in profit.
What it looks like on the chart
Below are two real trades by the robot in the GOLD H4 test. Both are from the forward period, which the optimizer did not see: one winner and one loser, so you can see the robot as it really is. The purple box marks the 80-20 signal candle; the yellow line is the EMA 100.
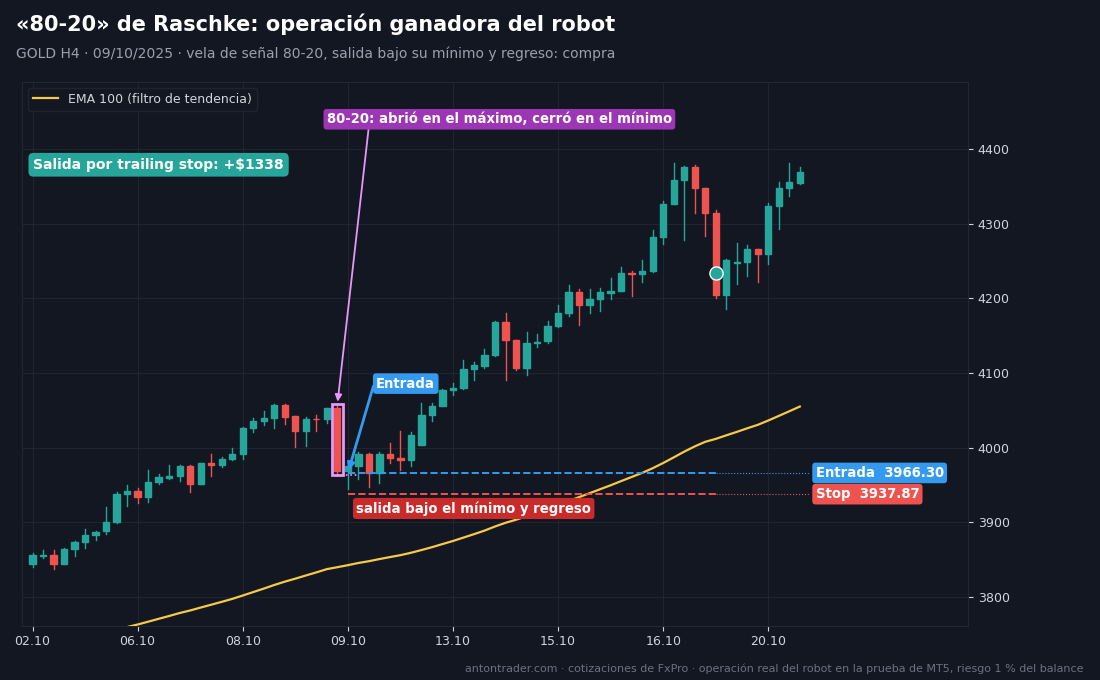
Winning trade. On October 9, 2025, an 80-20 candle appeared on gold: it opened at the high and closed at the low. The next candle dropped below its low and came back. The robot bought at 3,966.30, with a stop at 3,937.87. The trend above the EMA 100 continued, the trailing stop followed below the lows of the last six candles, and on October 17 the trade closed at 4,233.93: +$1,338.
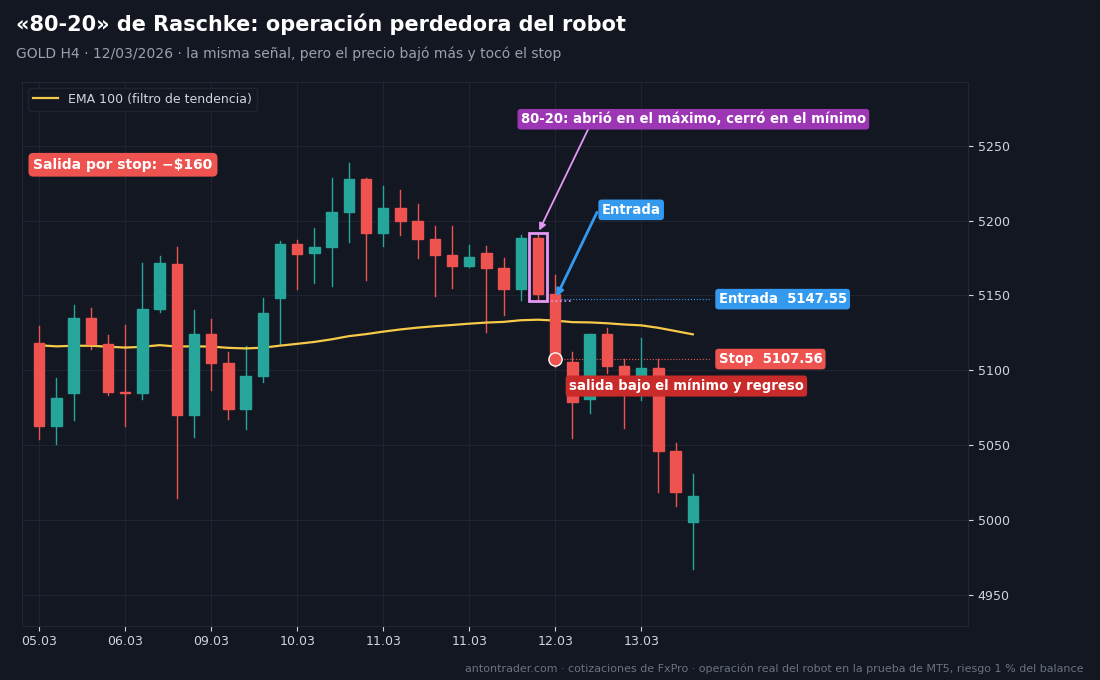
Losing trade. On March 12, 2026, the picture was the same: an 80-20 candle, a drop below its low, and a return. The robot bought at 5,147.55, with a stop at 5,107.56. But this time the sellers were not exhausted: three hours later the price dropped further and hit the stop: −$160. This is what most of this robot’s trades look like: a small loss, after which it waits for the next signal.
By hand: open the GOLD chart on H4 and add an EMA 100. Look for a candle that opened in the top fifth of its range and closed in the bottom fifth. If the price is above the EMA 100 and the next candle dropped below the low of the signal candle and then came back to it, buy. Place the stop below the low of the entry candle, but no less than 0.9 ATR away. With each new candle, move the stop up below the low of the last six candles, and do not set a take profit.
Robot results: training and forward
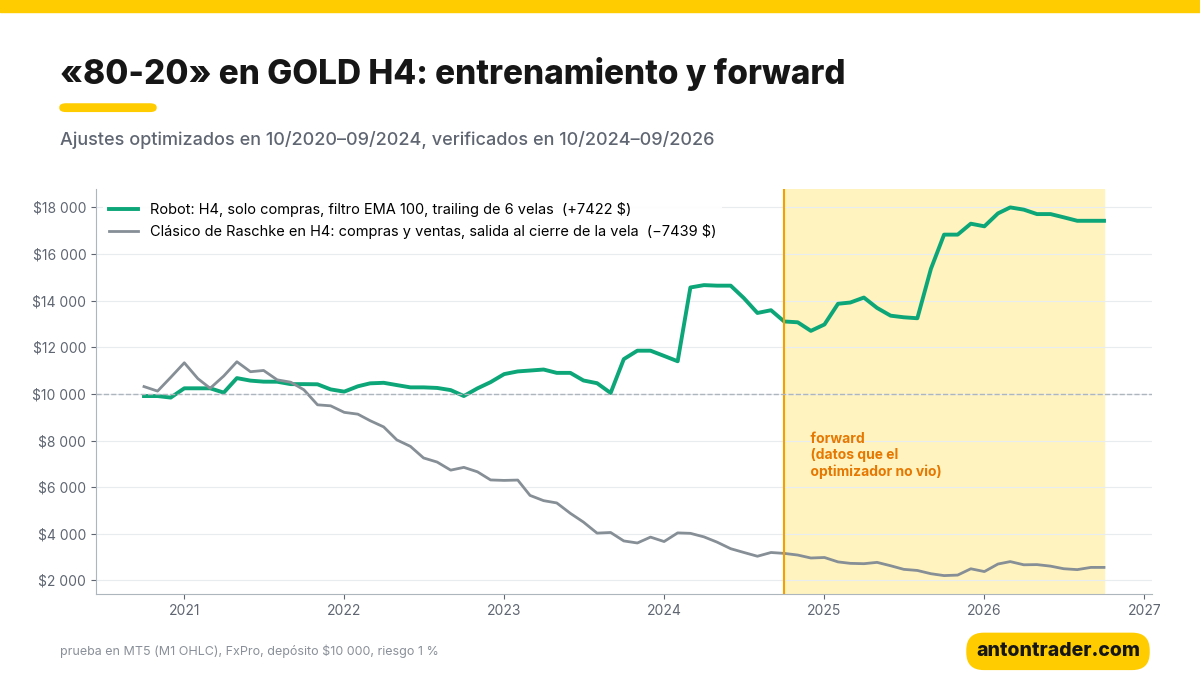
To avoid fooling myself with overfitting, I split the history into two parts. The parameters are chosen using only 10/2020–09/2024. Then the robot takes the exam on 10/2024–09/2026, months the optimizer did not see. The test: MetaTrader 5 strategy tester, a FxPro demo account with its quotes, spreads, commissions, and swaps, $10,000 deposit, 1:500 leverage, “1 minute OHLC” mode.
| Period (GOLD H4) | Return | Profit factor | Max. drawdown | Trades |
|---|---|---|---|---|
| Training, 10/2020–09/2024 | +35.9% | 1.49 | 13.6% | 123 |
| Forward, 10/2024–09/2026 | +24.8% | 1.84 | 9.5% | 65 |
| All 72 months, 1% risk | +74.2% | 1.64 | 17.1% | 188 |
| All 72 months, 2% risk | +173.3% | 1.60 | 31.8% | 188 |
| Longest pause without a new high | ≈ 19 months (05/2021–01/2023) |
The most important thing here is the forward test. On unknown data, the profit factor rose from 1.49 to 1.84, and the drawdown was smaller than in training. And it is not just one lucky combination of numbers: of 12 sets tested with the same key rules (20% zone, longs only, EMA 100 filter), 10 stayed positive in the forward test, and all five sets that were profitable in training also made money in the forward test. I’ll be frank with you about the money: over 72 months, commissions took $135, and the swaps on gold buys at FxPro took $1,974: about one fifth of the profit before costs. The robot holds a trade from a few hours to several days, and every night a swap is paid on a gold buy.
📊 Download the robot and the parameters for GOLD H4
Why the “internet” 80-20 doesn’t work and this one does
First I ran the pattern exactly as Raschke and Connors describe it: daily chart, 80-20 candle, entry on the return to its low (or its high, for sells), stop beyond the day’s extreme, exit at the end of the day. Buys and sells, seven markets, 72 months:
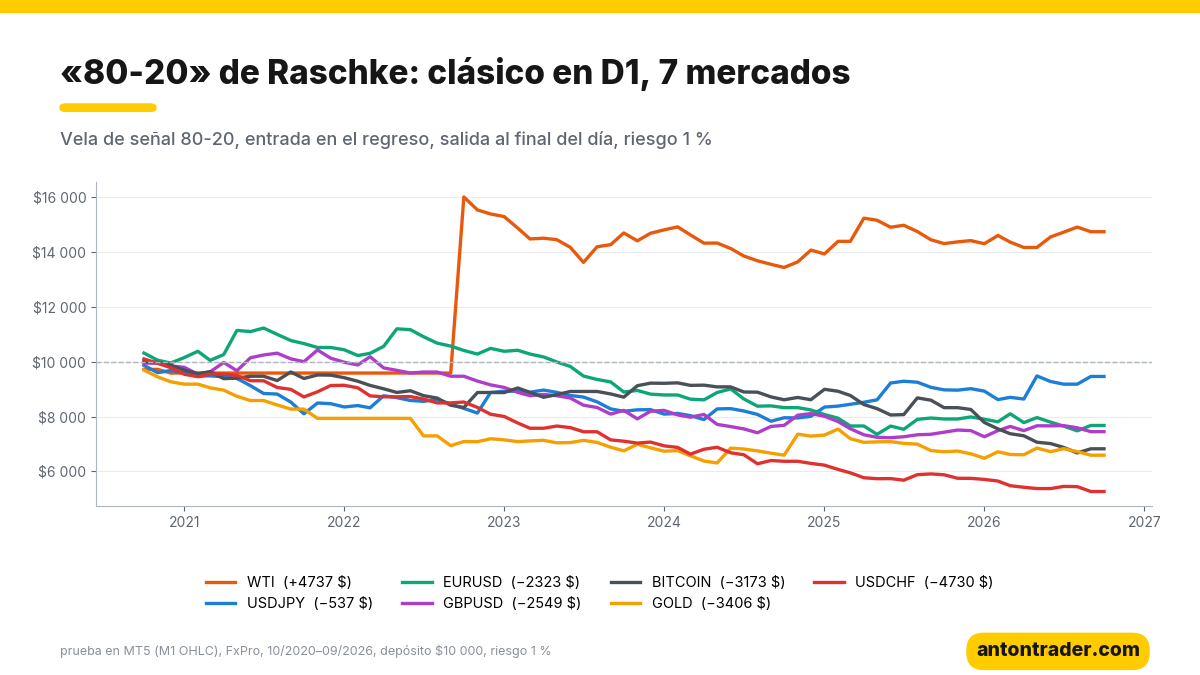
| Instrument (D1) | Result | Profit factor | Max. drawdown | Trades |
|---|---|---|---|---|
| WTI (oil)* | +47.4% | 1.40 | 36.3% | 149 |
| USDJPY | −5.4% | 0.95 | 23.5% | 220 |
| EURUSD | −23.2% | 0.79 | 36.2% | 201 |
| GBPUSD | −25.5% | 0.77 | 34.4% | 206 |
| BITCOIN | −31.7% | 0.66 | 33.6% | 185 |
| GOLD | −34.1% | 0.59 | 40.0% | 176 |
| USDCHF | −47.3% | 0.51 | 49.3% | 193 |
* The positive result on oil is a data accident: the tester’s WTI quote history is missing the period from early 2021 to October 2022, and a single buy “hung” through that whole gap and made $4,929. Without it, the classic on oil gives about −1.9%. So, to be honest, the classic loses in all seven markets. There are three reasons:
- End-of-day exit. The pattern catches the turn, but gives it only a few hours. Losing trades close at the full stop, and winning trades close with a small piece of the move.
- Sells against the trend. In these years gold more than doubled, and the classic sold every “reversal” candle near the highs.
- A stop that is too tight. The stop behind the day’s low is usually a fraction of an ATR. The spread and normal noise hit it before the turn has time to happen.
The robot that works differs in exactly that: H4 instead of D1, to get more signals; longs only and only above the EMA 100; a stop no smaller than 0.9 ATR; and instead of exiting at the end of the day, a trailing stop that lets the profit grow. Raschke’s idea, buying when the sellers have taken out the stops below the low of a strong red candle and run out of strength, stayed the same. For comparison: the classic parameters on the same GOLD H4 lost 74.4% in 72 months. I did not take the optimization on oil into account because of the gap in the quotes, so the robot is configured only for GOLD H4, and I don’t recommend taking it to other markets without your own test.
The risks, with no makeup
- Long pauses. From the end of May 2021 until January 2023 the robot’s balance did not mark a new high: about 19 months. The deepest balance drawdown was 14.1%, from May to December 2024; by equity, 17.1%. It pays to prepare for that patience in advance.
- The profit comes from a few big trades. It wins 28% of its trades, so streaks of 5 to 10 small stops in a row are normal. The biggest trade, gold’s rally in March 2024, made $3,586: almost half of the net profit over the 72 months. If you miss a trade like that because you turned the robot off in the middle of a streak of stops, the result will be very different.
- The robot only buys gold. If gold enters a long decline, the EMA 100 filter will stop the buys, but the first trades at the turn will be losers. The swaps on buys are negative: it is a fixed cost of holding the position.
- A 2% risk also doubles the drawdown: 31.8% instead of 17.1%. I would start with 1% and raise the risk only after seeing the robot work live with you.
Where to run the robot
The robot works in MetaTrader 5 with any broker that offers gold (XAUUSD or GOLD). My test was done at FxPro. The other brokers in my ranking also work: RoboForex and Tickmill. Before putting it on your account, run it in your broker’s tester: it takes an afternoon and shows you how it behaves with your quotes, spreads, and swaps. For it to work without interruptions, leave the platform on a VPS: the robot has to see every H4 candle and move the stop up on time.
Download the “80-20” robot for free
The robot is free for clients of the brokers in my ranking:
- Open a MetaTrader 5 account with one of the brokers above (or use the one you already have).
- Go to the Telegram bot with the button and send your account number.
- After verification, the bot sends you the file: the robot, the parameters for GOLD H4, Raschke’s classic parameters for your own experiments, and the instructions.
📊 Download the “80-20” robot for free on Telegram
My conclusion
The “80-20” in its classic form is a precise observation with an awkward exit: the pattern is good at finding the moment when the sellers are exhausted, but it closes the trade before the market has time to prove it, and it also trades against the trend. If you trade only with gold’s trend, give the stop room, and follow the profit with a trailing stop, you get a robot that made 74% in 72 months with a 17% drawdown, and that made 25% on two unknown years with a profit factor of 1.84. The forward test confirmed it, and neighboring settings with the same rules behaved the same way; that is why I have confidence in this robot. But remember: it makes money from a few big trades and knows how to sit still for a long time. Take care of your deposit: start on demo and with a small risk.
Today I also published the analysis of Toby Crabel’s NR7, the breakout of the narrowest candle of seven. There the test ended differently. Other Linda Raschke strategies: the “Holy Grail”, which passed the test on USDJPY, and Turtle Soup, which did not. On gold, the TTM Squeeze and Heikin-Ashi also passed the test.
Why 72 months?
The market changes fundamentally every 3–5 years: the participants and the volatility change, and trends give way to ranges. Gold is a good example. From 2021 to 2023 it moved in a wide range, and the robot spent almost a year and a half without marking a new high. Since 2024 a strong rally began, and the same pattern started to win. A 10–20 year test would have blended those eras into a single average figure. You have to choose a strategy for the current market, and change it when the market changes; that applies to this robot too: if gold enters a long decline, it will stop working.
That is why I built my app “Find your strategy”, in the browser or in Telegram. There you can test any idea on a history of up to 72 months, and every 2 weeks the app automatically runs tens of thousands of strategies and shows you the ones that work over the last 6, 12, and 36 months. It does not promise profits: it helps you notice in time that the market has changed.
Backtest results on historical data do not guarantee future results.
Sources
- Linda Bradford Raschke and Laurence A. Connors: “Street Smarts: High Probability Short-Term Trading Strategies” (M. Gordon Publishing, 1995), chapter “80-20’s” (open in the top 20% of the range, close in the bottom 20%, entry on the return to the low).
- Own tests in MetaTrader 5 on the FxPro demo server, October 2026.
Where to trade
These are the brokers and exchanges I use that work with clients from Latin America. Always check that the service is available in your country and start small.
Risk warning: CFDs, Forex, and crypto derivatives carry a high risk of losing money due to leverage. This article is not investment advice.