I love strategies like this one! They are simple. Logical. And stable for decades. When a strategy uses such a strong market regularity, that’s no surprise. The hard part is finding those market laws. And even harder is understanding how to use them. But you’re in luck: today I’m revealing the strategy that allowed me to create dozens of profitable robots.
At its core, the algorithm doesn’t use averaging, martingale or other dangerous and complex mathematical methods. You’re going to learn how to use a strategy with short stop loss orders. I would call them microscopic: most of the time they measure 20–40 points on a 5-digit quote. It’s one of the strategies with the shortest stops I know of.
It also uses a dynamic trailing stop on the position: 5–10 minutes after entering, you already move the stop to a profitable zone and enjoy the process.
So? If you’re ready to trade with micro risk and close profits of up to 5 times the size of your stop loss, this will be your favorite strategy for Forex and cryptocurrencies.
Technical characteristics
- Timeframe: 5-minute charts (M5).
- Assets: EURUSD, GBPUSD, USDJPY and top-30 cryptocurrencies.
- Leverage: from 1:10 and up.
- Risk management: 1 lot per 10,000 units, or 1% of your capital on the exchange.
The logic of MAGNETO
The market has many interesting regularities. Some we find by chance while looking at charts. Others were revealed while creating automated algorithms. Many, like this one, have been known for a long time, but only became effective after developing proprietary trade management methods in the robots.
The task of MAGNETO is to look for gaps in the market, which the market closes in 90% of cases. And almost always (I’ve never seen otherwise!) the correction toward that zone starts from the first liquidity zone.
And if you’re worried that gaps are something rare, relax! They appear far more often than the losing signals of a moving average in a sideways market 🙂
How do you know you have a gap in front of you?
When we talk about a gap, we usually picture a hole in the chart: a void between candles that normally follow one another.
In reality, that’s not the only case in which we can talk about a “gap.” Those who sell smart money as a new strategy, or even as a replacement for technical analysis, call it an “imbalance.”
Even so, a sharp price “jump” is precisely a gap: a zone where no trading took place because of sudden supply or demand. Afterward, the price tends to close that stretch. But you can only call it a gap on small timeframes like M5. Why? Because in 5 minutes the price doesn’t manage to trade through that “jump.”
To identify a gap, you need to find a hole in the quotes, or a 5-minute candle that made a sharp “jump” and wasn’t covered by the wicks of the candles to its left and right. That is also our gap candle.
The MAGNETO algorithm
The key to this strategy, as I already said, is not the gap itself. The market’s tendency to close it has been known for so long that almost everyone has traded it. Yes, the market often closes the gap.
But not always, and often from anywhere. That is, after the gap the price can travel many more points before “remembering” to fill the hole.
That’s why the gap is only the target of the trade. But when do you open it, and what do you do if the price doesn’t close it? Many people average down, but as you’ve already understood, that’s not our option 🙂
Entry points
To catch an entry with a minimal stop loss, capturing the whole move until the gap closes, you need to study the theory of following trend candles. I call it the “true trend candles concept”, by analogy with the market’s trend structure, where we identify true lows and highs.
With Japanese candlesticks the actions are simpler. To begin with, we already know a couple of things:
- which direction to look for the entry (toward the gap);
- a candle whose close engulfs the extreme of the previous one clearly carries more strength.
This way we can find the true extremes using “trend candles” and use them as levels for the stop loss.
The concept of true trend candles
It holds that the true candle confirming the trend is the one that closes beyond the extreme of the previous one. It carries more weight, and its opposite extreme is the local invalidation of the scenario: that’s where we can place the stop. The first true trend candle is also the entry point for the gap close. Step by step:
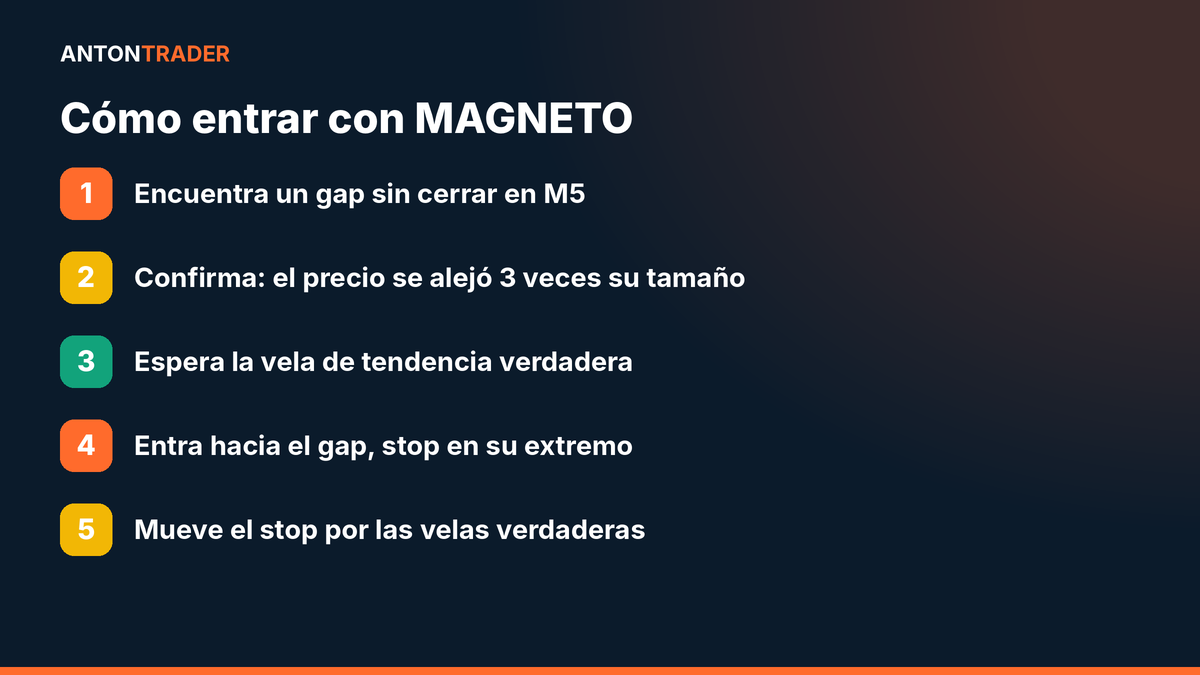
- First we find an unclosed gap on M5 and check that the price moved away from the gap by at least 3 times its size (this confirms that the gap truly hasn’t closed).
- Once confirmed, we wait for the true trend candle in the direction of the gap.
- We move the stop loss step by step along the true extremes of the true candles.
This management concept also works very well on other timeframes, and we’ll see it again in my other strategies. But in this algorithm, remember that its best application is on M5.
The secret to success in Forex and crypto
The most important thing in the strategy is to trade the gaps that appear during the market’s active sessions. In Forex that’s from 10:00 to 18:00 (UTC+3); the crypto market almost never sleeps, although I avoid weekends and the London session from 8:00 to 12:00 (UTC+3).
I also recommend these filters:
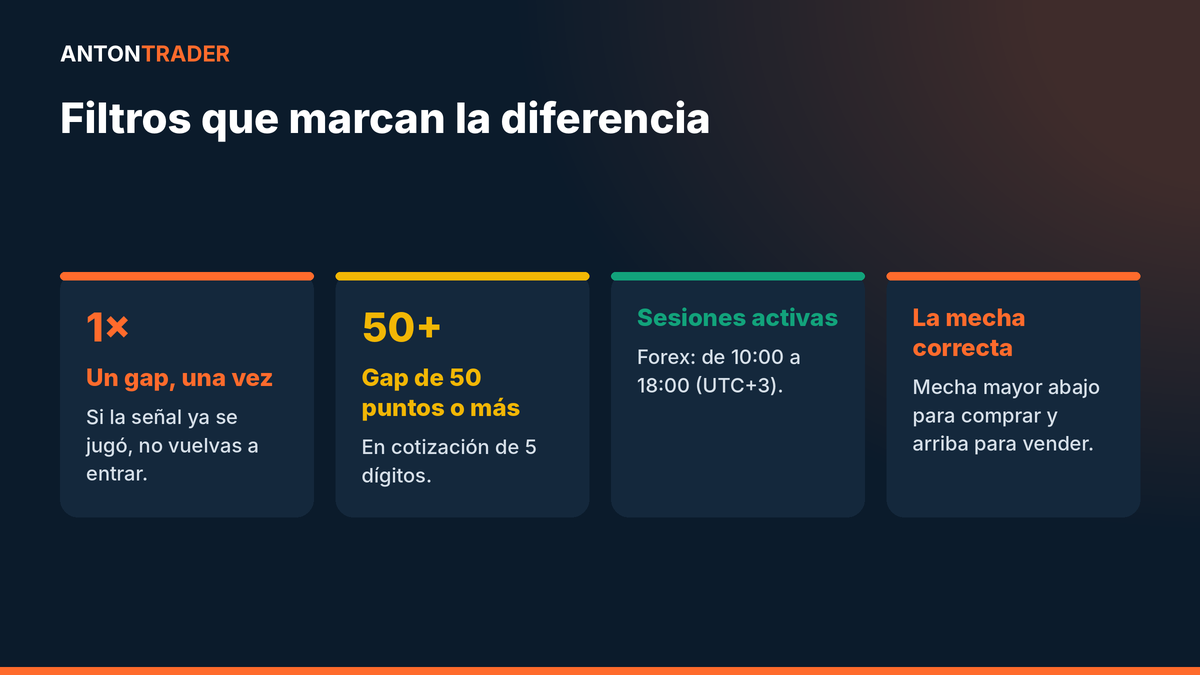
- Trade each gap only once. If the signal has already played out (positive or negative) without reaching the TP, there’s no point in re-entering.
- It’s important to enter with the true trend candle that closed beyond the true extreme of the opposing candle. That is, if the trend was bullish and we’re looking for a reversal down, the true bearish candle must close below the last true low of the bullish one.
- On the entry candle, the larger wick must be at the bottom for buying and at the top for selling. If it’s the other way around, the entry is canceled.
- The gap size must be at least 50 points on a 5-digit quote.