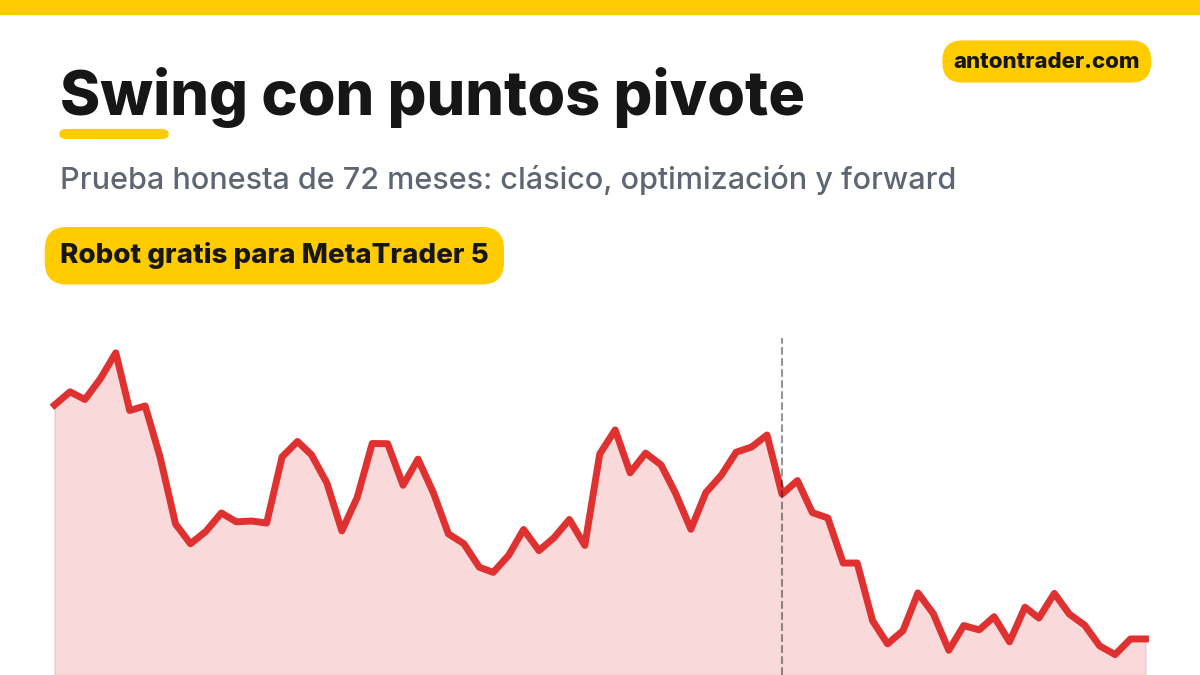
If you’ve ever traded with pivots, you know the feeling: price reaches P, touches it, bounces… and an hour later it breaks the level and takes your stop. I wanted to know whether that’s just a bad day’s luck or a pattern. I coded a robot with the classic rules for the pivot bounce and ran it on seven markets over 72 months. The answer was clear, and it may save you more than one deposit. At the end I’ll show you which robot makes more sense to use instead of pivots on the same USDJPY.
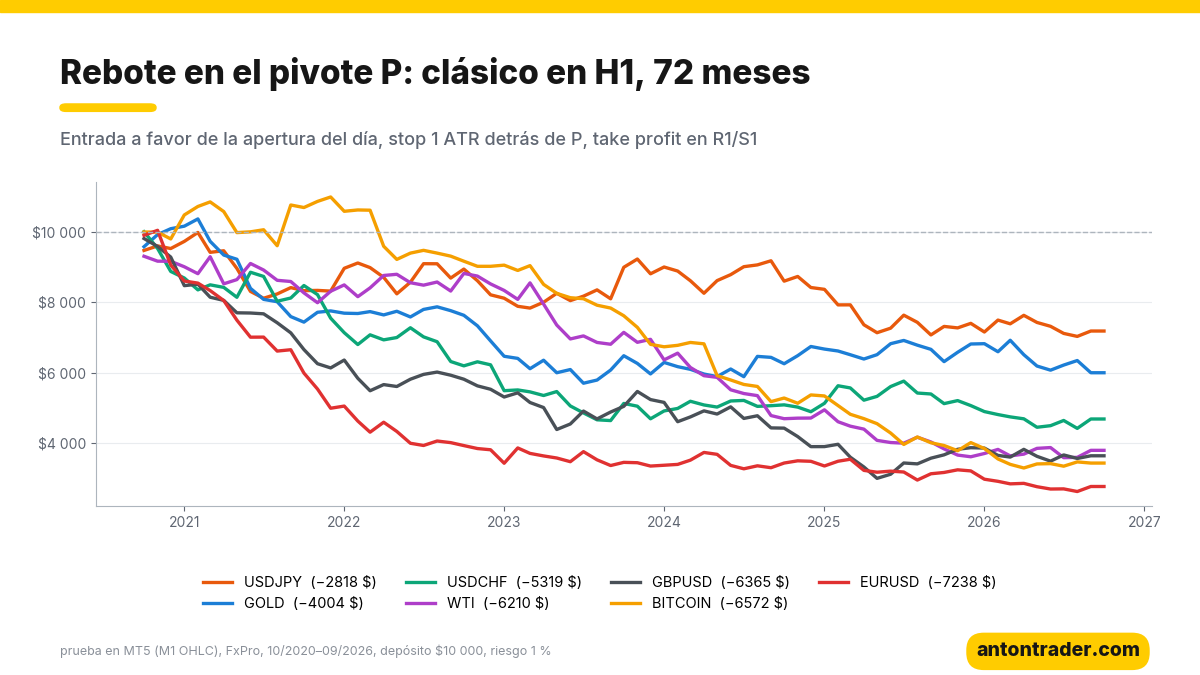
- The pivot bounce lost in all 7 markets: from −28% to −72% over 72 months, with drawdowns of up to 76%.
- Even in the best market, USDJPY, commissions ate everything: before costs, the strategy was at zero.
- Optimization didn’t save it: on gold, out of 30 sets that were profitable in the past, only 5 stayed positive on new data.
- What does work on USDJPY: the Supertrend robot, +40% over 72 months with a 4.8% drawdown and it passed the check on new data.
📊 Download the Supertrend robot for free, the one that actually works
The strategy rules
Classic pivots come from the exchange floor: floor traders calculated them every morning using yesterday’s daily candle. John Person explains in detail how to trade with them in his book “Candlestick and Pivot Point Trading Triggers.” The formulas:
- P = (yesterday’s high + low + close) / 3: the central level.
- R1 = 2 × P − yesterday’s low, S1 = 2 × P − yesterday’s high: the nearest resistance and support.
The robot trades the most popular scenario, the bounce off P in the direction of the day:
- If the day opened above P, we only look for buys; if it opened below, only sells.
- Buy: a one-hour candle touches P from above and closes above it. Entry at the open of the next candle. Sells are the opposite.
- Stop: 1 ATR (H1) beyond the P level. Take profit: R1 for buys, S1 for sells.
- One trade per day, entries from 08:00 to 20:00 server time, close at 23:00. Risk of 1% of the balance.
What it looks like on the chart
Below are two real trades by the pivot robot on USDJPY H1 (from the best optimized set: buys only, stop 2 ATR below P, take profit at R1). This is what trading with pivots looks like in real life: sometimes the level holds, sometimes it doesn’t.
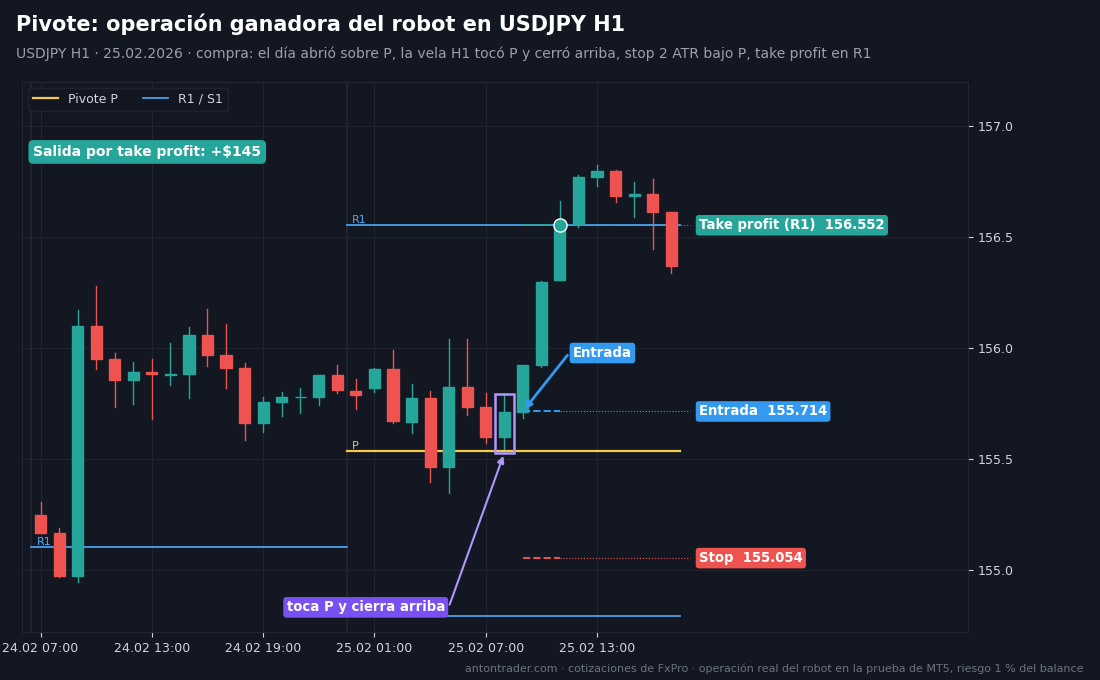
Winning trade. On February 24, 2026, USDJPY went from 154.523 to 156.280 and closed at 155.810. That gives the February 25 pivot: P = 155.538, R1 = 156.552. The day opened at 155.808, above P, so we looked for buys. At 08:00 server time, the one-hour candle dropped to 155.526, touched P and closed at 155.713. The robot bought at 155.714, with a stop at 155.054 and take profit at R1, 156.552. Two hours later the pair reached the target: +$145.
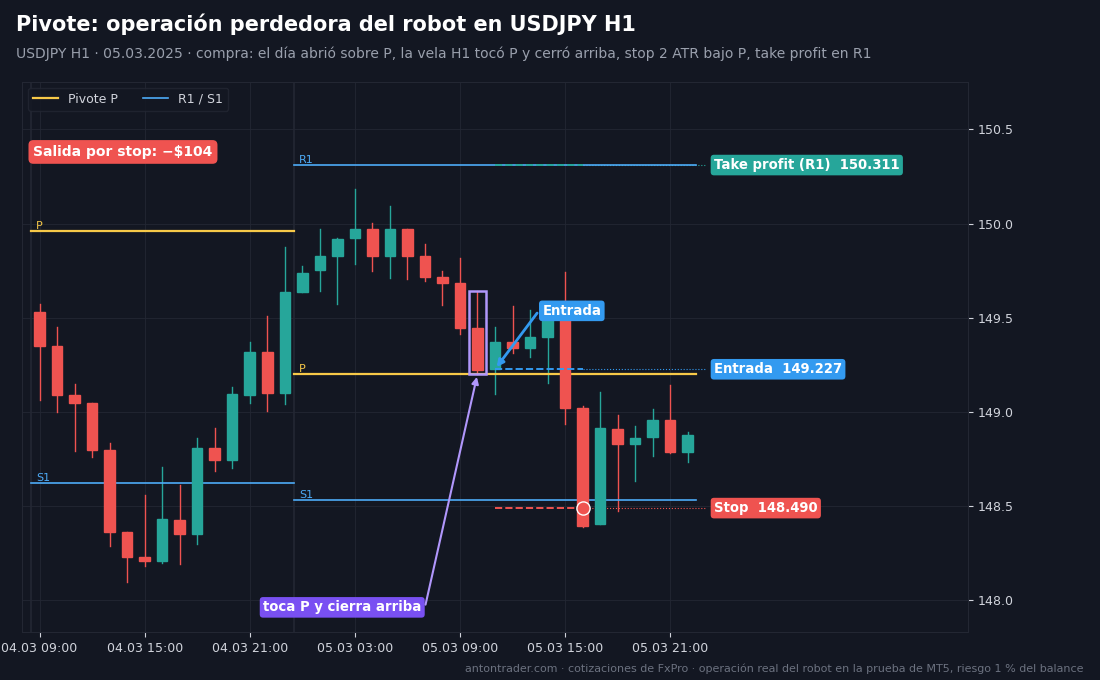
Losing trade. March 5, 2025: P = 149.203, R1 = 150.311, and the day opened above P, at 149.639. At 10:00 the candle touched P (low of 149.201) and closed at 149.225: formally, a signal. The robot bought at 149.227, with a stop at 148.490 and take profit at 150.311. A few hours later the pair cut through P to the downside and hit the stop: −$104. The level that “everyone sees” didn’t hold the price; it just gathered the stops of those who trusted it.
By hand: open the USDJPY daily chart and calculate P, R1 and S1 using yesterday’s candle (or turn on the Pivot Points indicator on your platform). If today the day opened above P, switch to H1 and wait for a candle to touch P and close above it. Buy at the open of the next candle, stop 2 ATR below P and take profit at R1.
How I ran the test
MetaTrader 5 Strategy Tester, a FxPro demo account with its quotes, spreads, commissions and swaps. From October 2020 to October 2026, exactly 72 months. $10,000 deposit, 1:500 leverage, 1% risk per trade, “1 minute OHLC” mode. I’ll explain why exactly 72 months at the end of the article.
The pivot bounce over 72 months: seven negatives out of seven
| Instrument (H1) | Result | Profit factor | Max drawdown | Trades | Commissions |
|---|---|---|---|---|---|
| USDJPY | −28.2% | 0.92 | 32.4% | 720 | −$2,711 |
| GOLD | −40.0% | 0.87 | 49.0% | 772 | −$551 |
| USDCHF | −53.2% | 0.83 | 58.2% | 844 | −$2,405 |
| WTI (oil) | −62.1% | 0.82 | 65.8% | 830 | — |
| GBPUSD | −63.7% | 0.79 | 71.0% | 895 | −$1,667 |
| BITCOIN | −65.7% | 0.77 | 71.6% | 757 | −$1,024 |
| EURUSD | −72.4% | 0.70 | 76.1% | 858 | −$1,791 |
- The pivot is not a wall. Price touches P almost every day, but it bounces off it about as often as it breaks it. Winning trades are only 33–42%.
- A hundred trades a year means a hundred commissions. On USDJPY, before costs, the strategy was at zero (−$50); commissions turned it into −28%.
- Drawdowns of 49–76% in most markets, and the strategy never recovered from them. It’s not a temporary dip: it’s a slow loss of the deposit.
What if optimization saves it?
I let the optimizer choose the entry window, the stop, the target, the filters and the direction on USDJPY H1 and GOLD H1, using only 10/2020–09/2024. Then I tested what it found on 10/2024–09/2026, months it hadn’t seen.
- GOLD H1: the best set on past data showed +238%. On new data it lost 12%. Out of 30 profitable sets, only 5 stayed positive. That’s overfitting: the optimizer found what happened, not what will repeat.
- USDJPY H1: the best set in the forward test (buys only, stop 2 ATR, take profit at R1, no overnight close) gave +10.5% in two years, but with a profit factor of 1.22 and a drawdown of 13.9%. Out of 58 profitable sets, exactly half stayed positive on new data: like flipping a coin.
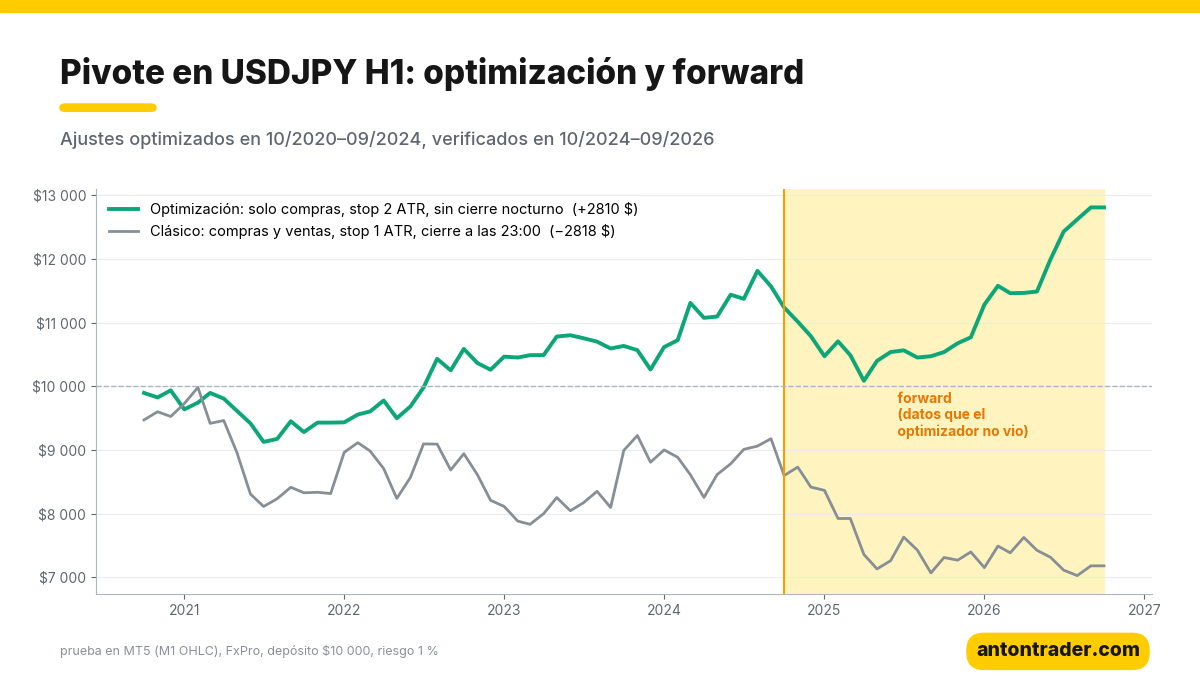
Even the positive result on USDJPY doesn’t rely on the strength of the level, but on the rise of the pair itself: the optimizer removed the sells and turned the “pivot bounce” into buying pullbacks. If you want to buy USDJPY pullbacks, there’s a much more reliable way to do it, and I show it to you below.
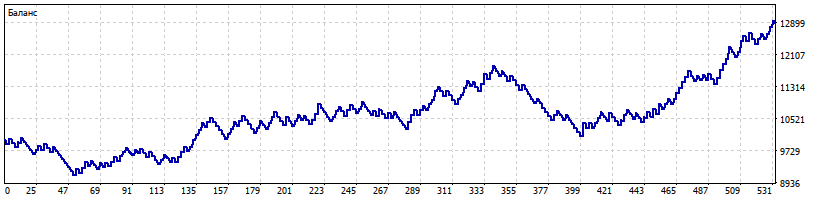
What to use instead of pivots: robots that passed the test on USDJPY
On the same USDJPY and in the same 72-month test, two robots held up under the check on new data:
| Robot | Over 72 months | Max drawdown | Forward 10/2024–09/2026 |
|---|---|---|---|
| Supertrend, USDJPY H4 | +40.2% | 4.8% | +11.3%, profit factor 2.24 |
| Williams volatility breakout, USDJPY D1 | +42.8% | 6.5% | +14.2%, profit factor 1.56 |
| For comparison: pivot bounce, USDJPY H1 | −28.2% | 32.4% | −21.6% |
Both trade the same move the pivot tries to profit from, the rise of USDJPY, but they enter on the strength of the trend and not on a level that everyone sees. That’s why their drawdowns are five or six times smaller.
📊 Download the Supertrend robot
📊 Download the “Volatility Breakout” robot
Where to run them and how to download them
The robots work on MetaTrader 5 with any broker that offers USDJPY. My test was done at FxPro. The other brokers in my ranking also work: RoboForex and Tickmill. The robots are free for clients of these brokers:
- Open a MetaTrader 5 account with one of the brokers above (or use the one you already have).
- Go to the Telegram bot with the button and send your account number.
- After verification, the bot sends you the file: the robot, the ready-made parameters and the instructions. Run it in your broker’s tester (it takes an afternoon) and then put it into operation.
If you want to experiment with pivots yourself, the bot also has the Pivot robot, with the classic and the optimized parameters. It’s a robot for research: I wouldn’t put it on a real account.
📊 Download the robot for free on Telegram
My conclusion
Pivots are still a useful marker: they show where orders will gather today and where people will expect a reaction. But a level that everyone sees gives no edge to whoever bounces off it. Over 72 months the bounce off P lost in all seven markets, and the optimization on gold turned out to be pure overfitting. Protect your deposit: if you want to profit from USDJPY, follow the trend, not the level. The Supertrend and the volatility breakout confirmed it.
The breakout of the first London hour also failed the check earlier: there too, you trade levels that everyone sees. Other analyses: Elder’s Triple Screen, the inside bar breakout and Bollinger Bands.
Why 72 months?
The market changes fundamentally every 3–5 years: the participants and the volatility change, and trends give way to ranges. Pivots were invented for the exchange floor, where the morning levels were known to a few hundred people. Today every platform and every robot calculates them, and during the day price is moved by algorithms that know where the stops below P are. Even in these six years the picture changed: on USDJPY, until the fall of 2024 the classic was almost at zero, and in the forward test the loss accelerated. Testing an idea like this over 10–20 years means mixing the market where the level worked with the market where it became a trap. A strategy has to be chosen for the current market, and changed when the market changes.
To search for strategies like these I built my app “Find your strategy”, in the browser or on Telegram. There you can test any idea, including your own idea with levels, over a history of up to 72 months, and every 2 weeks the app automatically runs tens of thousands of strategies and shows you the ones that work over the last 6, 12 and 36 months. It doesn’t promise profits: it helps you tell a living idea from a pretty legend.
Backtest results do not guarantee future results.
Sources
- John L. Person, “Candlestick and Pivot Point Trading Triggers”: the classic floor trader pivots (P, R1, S1).
- My own tests on MetaTrader 5 on the FxPro demo server, October 2026.
Where to trade
These are the brokers and exchanges I use that work with clients from Latin America. Always check that the service is available in your country, and start small.
Risk warning: CFDs, Forex and crypto derivatives carry a high risk of losing money due to leverage. This article is not investment advice.