The Keltner channel is one of the oldest breakout systems: in 1960 the Chicago grain trader Chester Keltner described it in his book as the “10-day moving average rule.” If the price leaves the channel, a move has started and you need to jump on. It sounds logical, and in many trading courses it is presented as a “professional’s tool.” I coded a MetaTrader 5 robot with Keltner’s rules to the letter and ran it on seven markets over 72 months. The classic lost almost everywhere: in five out of seven markets, with losses of up to 23% of the deposit. But when I doubled the width of the channel and kept only buys, a robot appeared on gold H4 that passed the check on future data. I’ll show you the numbers, examples of trades and the robot, with its risks in plain view.
The strategy rules
The channel is built around a middle price. The classic Keltner version:
- Middle line: the 10-day average of the “typical price,” (high + low + close) / 3.
- Channel borders: the middle line plus and minus the 10-day average daily range (high − low).
- Buy: the daily candle closes above the upper border. Sell: it closes below the lower one.
- Exit when a candle closes again on the other side of the middle line. Stop at the middle line. No take profit.
- Position size is calculated to risk 1% of the balance up to the stop. D1 timeframe, buys and sells.
The modern version, popularized by Linda Raschke, builds the channel with an EMA and the ATR. The robot also has that mode, and it proved useful in the optimization. In spirit it is a relative of the Turtles: buy strength, sell weakness.
What it looks like on the chart
Below are two real trades by the robot, from the gold H4 test. They come from the optimized variant: a 40-bar channel with a width of 2 ATR, buys only, a stop of 2 ATR and a take profit of 3 stops. Both are from the forward period, which the optimizer did not see, and they are consecutive, two days apart.
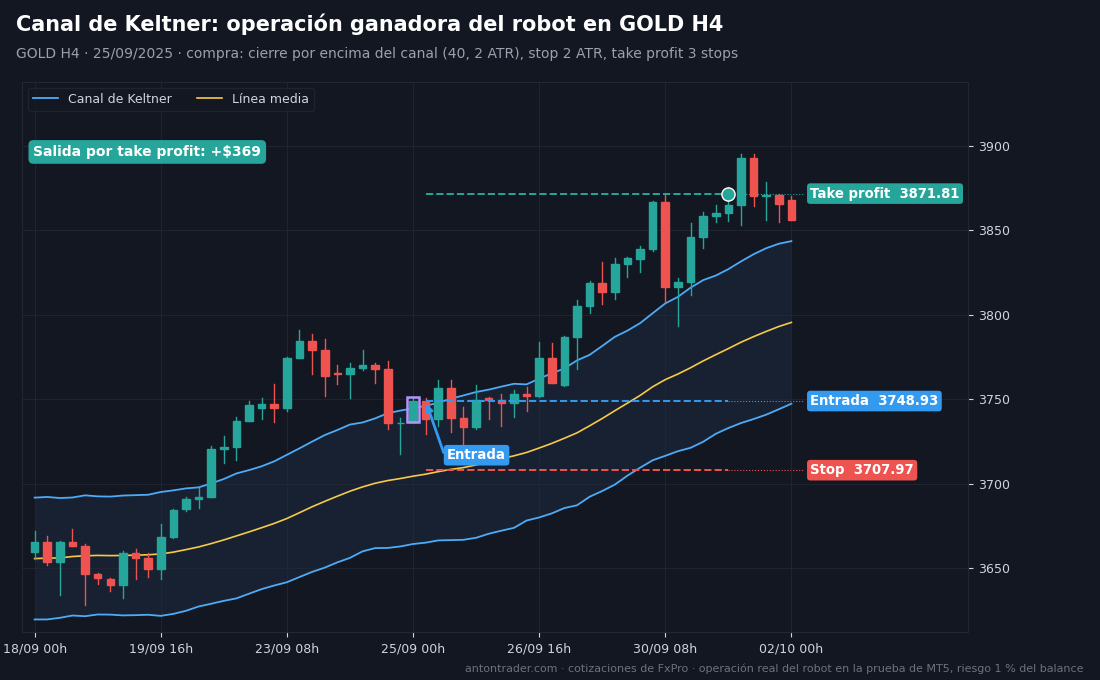
Winning trade. The H4 candle that opened at midnight on September 25, 2025 closed at 3748.97, above the upper border of the channel (around 3744.6). The robot bought at the open of the next candle, at 3748.93. Stop at 3707.97; take profit three times farther, at 3871.81. Gold kept rising and the target was hit on October 1: +$369.
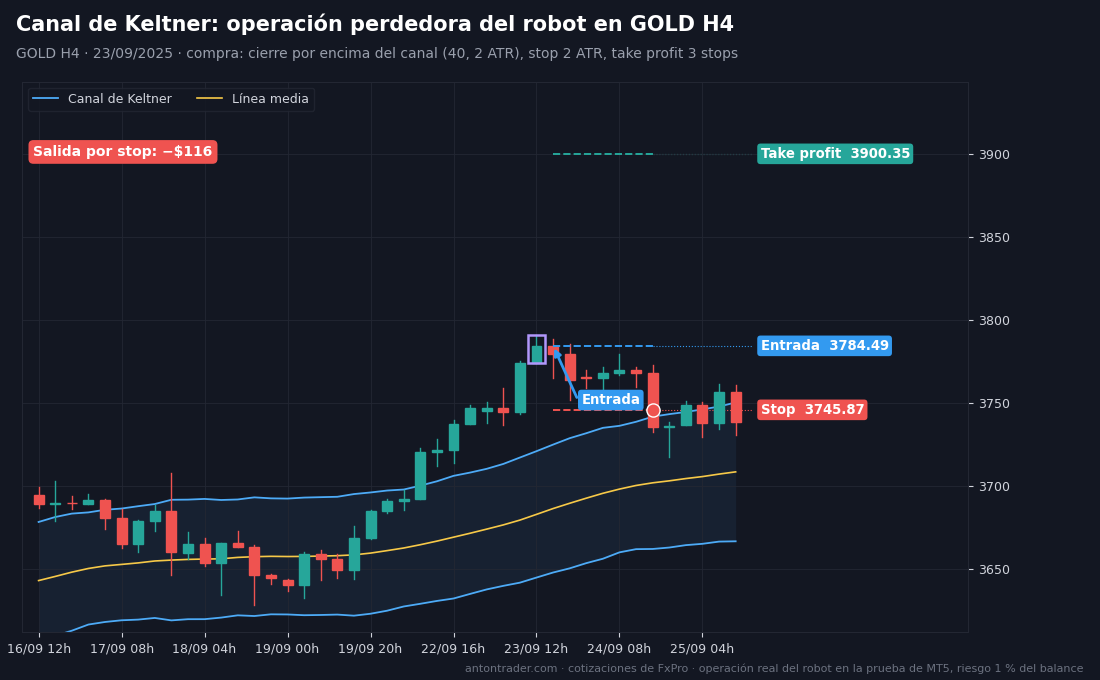
Losing trade. Two days earlier, on September 23, gold shot up and the candle closed well outside the channel. The robot bought at 3784.49, stop at 3745.87, take profit at 3900.35. But it was a local spike: the price pulled back and on September 24 the stop was triggered, −$116. A day later the breakout repeated, and that time it did work. That’s what a breakout system is like: it pays with stops for the right to be inside the trend.
By hand: MT5 doesn’t come with a built-in Keltner channel, but it’s easy to put one together with a moving average on the chart and the ATR, or with a free Keltner Channel indicator. On gold H4 you need a 40-bar channel with a width of 2 ATR. If the candle closes above the upper border, buy at the open of the next one, with the stop 2 ATR lower and the take profit at a distance of three stops.
How I ran the test
- MetaTrader 5 Strategy Tester, FxPro demo server: the broker’s real quotes, spreads and swaps.
- Period from October 2020 to September 2026, exactly 72 months. $10,000 deposit, 1:100 leverage, 1% risk per trade.
- “1 minute OHLC” mode, the closest to reality among the tester’s fast modes.
I’ll explain at the end why 72 months and not 10 or 20 years: the old years describe a different market. Three blocks: the classic with no adjustments → optimization only on 10/2020–09/2024 → check on 10/2024–09/2026, months the optimizer did not see.
Block 1. The classic over 72 months: five negatives out of seven
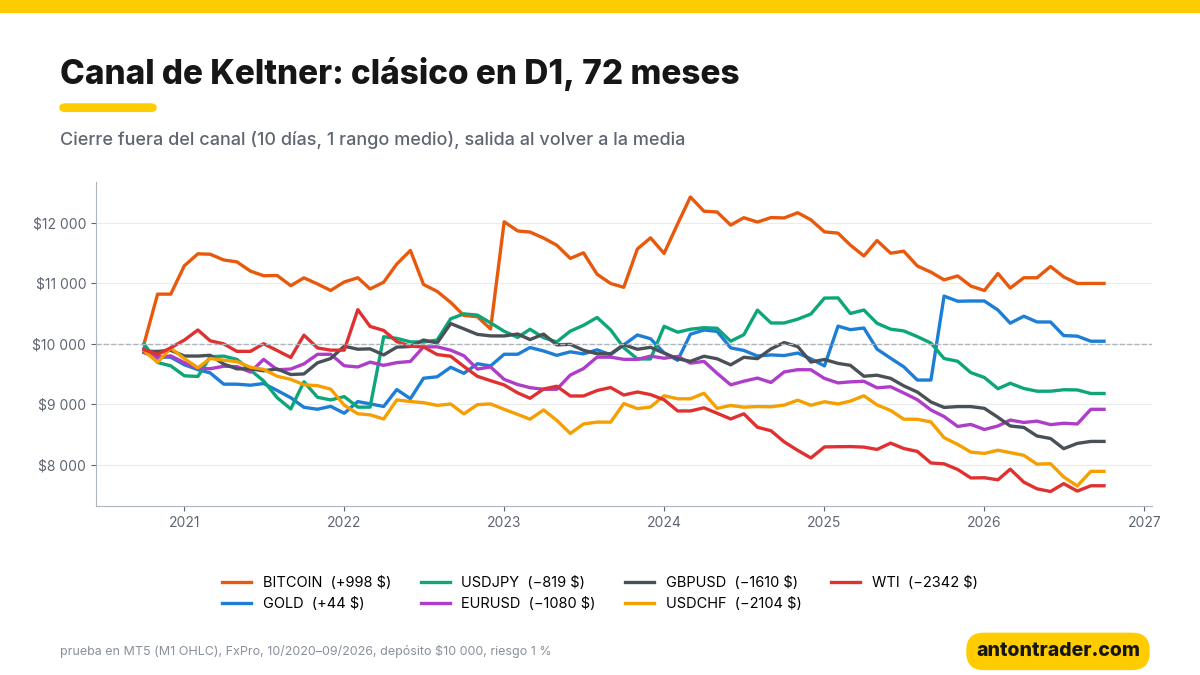
| Instrument (D1) | Result over 72 months | Profit factor | Max. drawdown | Winning trades | Swaps |
|---|---|---|---|---|---|
| BITCOIN | +$998 | 1.12 | 15.0% | 30% | −$1,653 |
| GOLD | +$44 | 1.01 | 14.9% | 31% | −$954 |
| USDJPY | −$819 | 0.88 | 17.0% | 30% | −$393 |
| EURUSD | −$1,080 | 0.80 | 15.8% | 38% | −$346 |
| GBPUSD | −$1,610 | 0.69 | 24.6% | 37% | −$318 |
| USDCHF | −$2,104 | 0.61 | 24.8% | 30% | −$776 |
| WTI (oil) | −$2,342 | 0.60 | 30.0% | 23% | −$777 |
Between 116 and 156 trades per market, about 20–25 per year. What you can see:
- A narrow channel catches noise. A width of one average daily range is exceeded on almost any strong day. The price leaves the channel, the robot enters, and two days later the price is back on the other side of the average.
- Currencies and oil, at a loss: from −$819 to −$2,342, with drawdowns of up to 30%.
- Bitcoin stays positive, but swaps ($1,653) ate more than half of what it earned.
- Gold, at zero: +$44 in six years with a 15% drawdown. Not even the 2024–2026 rally in gold could be exploited by the classic.
Block 2. Optimization on 10/2020–09/2024
I optimized on GOLD H4 and BITCOIN D1. I adjusted the channel period (10–40), the width (0.5–2.5), the type of width (average range or ATR), the exit at the middle line, the stop, the take profit from 0 to 3 stops, and whether sells are allowed.
- GOLD H4: of the sets with 30+ trades, only 46 were profitable in training, but 42 of them stayed positive in the forward test. Almost all with a wide channel and buys only.
- BITCOIN D1: 124 profitable sets in training; in the forward test, 68 positive. The best forward sets also have a wide channel (2–2.5), but with too few trades to draw conclusions: 11–16 in two years.
For gold I chose a set with a good forward result and profitable neighbors (channel of 35–40, width of 2–2.25 ATR, buys only):
| Parameter | Classic Keltner | Optimization (GOLD H4) |
|---|---|---|
| Channel period | 10 | 40 |
| Channel width | 1 average daily range | 2 ATR(40) |
| Direction | buys and sells | buys only |
| Stop | middle line | 2 ATR(14) |
| Take profit | no | 3 stops |
| Exit at the middle line | yes | no |
Basically, the optimizer said: the narrow channel is noise; trade only the strong breakouts and only in the direction of gold’s trend.
Block 3. Forward 10/2024–09/2026
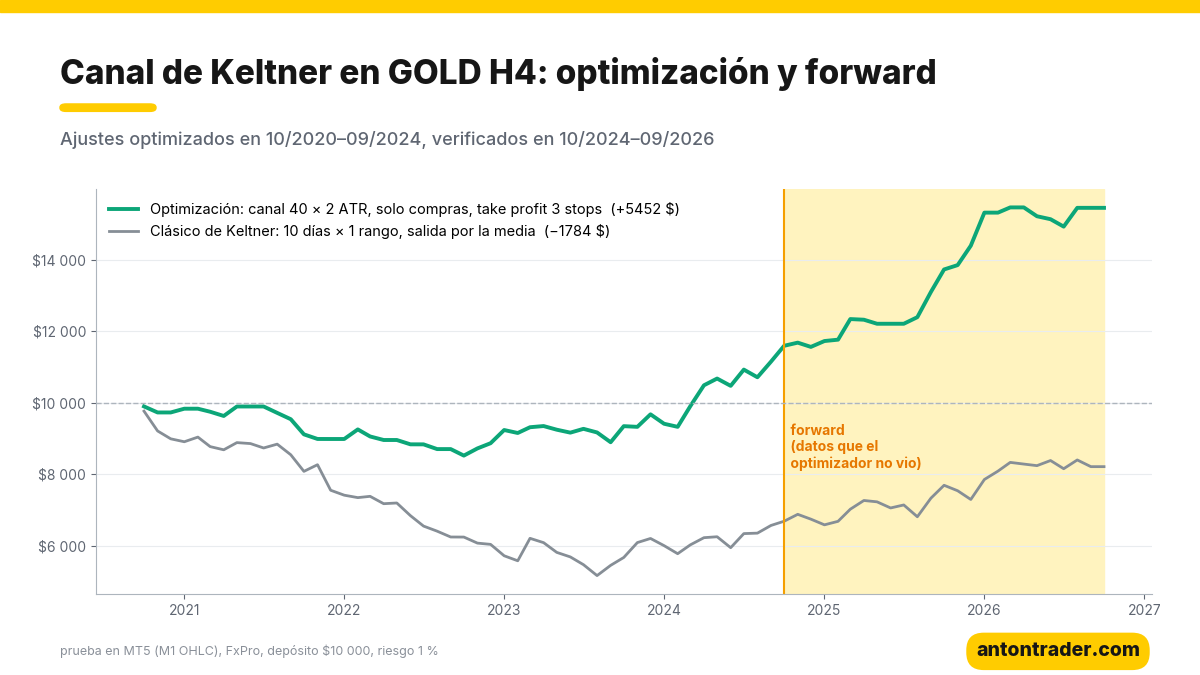
| Variant | Period | Result | Profit factor | Max. drawdown | Trades |
|---|---|---|---|---|---|
| Classic | 10/2020–09/2024 | −$3,360 | 0.76 | 49.4% | 428 |
| Optimization | 10/2020–09/2024 | +$1,152 | 1.22 | 15.8% | 80 |
| Classic | 10/2024–09/2026 (forward) | +$1,749 | 1.17 | 12.0% | 230 |
| Optimization | 10/2024–09/2026 (forward) | +$3,560 | 2.15 | 5.9% | 56 |
Each period was tested separately, starting with $10,000. The result:
- The classic on H4 is a catastrophe: over 72 months, −$1,784 with a 49% drawdown and 657 trades. Half the deposit was gone in the training period.
- The optimization passed the forward test: +$3,560, profit factor 2.15, drawdown of 5.9%, on data the optimizer did not see. That is more than it earned in the previous four years.
- But, to be honest: in training the set barely ended up positive (profit factor 1.22). The forward period coincided with the strongest rally in gold, and the robot only buys. It didn’t “predict” the trend: it simply didn’t get in its own way while profiting from it.
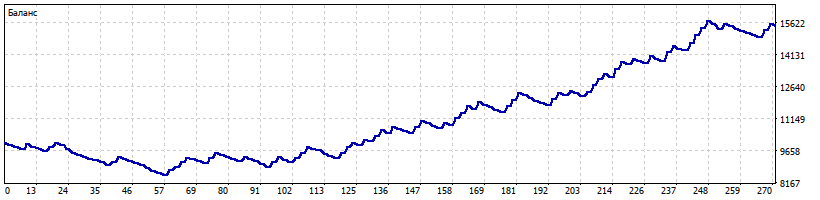
- Over the full 72 months: +$5,452 on $10,000, drawdown of up to 15.8%, 135 trades. Before swaps and commissions, $7,995; swaps on the gold buys took $2,511.
If you re-optimize the robot regularly, you can keep it in shape: the optimized .set shows what result this approach gives on gold.
The risks, with no makeup
- The robot only buys. It won with the 2024–2026 rally in gold. In a long decline or a range, it will keep collecting stops.
- The training was weak. In 2021–2023 the set barely made money, and the drawdown reached 15.8%. A good forward test doesn’t erase a weak past.
- Swaps. $2,511 in six years: a third of the profit before costs. Look for a broker with a lower swap on gold.
- Streaks of stops. 55–60% of trades are losers. Five or six stops in a row are normal in a breakout system. That’s why it’s best to keep the risk per trade at 0.5–1%.
Where to run the robot
The robot works in MetaTrader 5 with any broker that offers gold (GOLD/XAUUSD). My test was done at FxPro. The other brokers in my ranking also work: RoboForex and Tickmill. Before launching it, compare the swaps on gold buys: here they are the main expense.
Download the “Keltner Channel” robot for free
The robot is free for clients of the brokers in my ranking:
- Open a MetaTrader 5 account with one of the brokers above (or use the one you already have).
- Go to the Telegram bot with the button and send your account number.
- After verification, the bot sends you the file: the robot, the classic Keltner parameters, the ones optimized for GOLD H4 and the instructions.
📊 Download the robot for free on Telegram
My conclusion
The classic Keltner channel, in the 2020s, is a machine for buying at highs and selling at lows. The narrow channel reacts to every strong day, and in today’s market a strong day is more often a trap than the start of a trend. If someone teaches you to “enter on the channel breakout” without showing you a test, protect your deposit: they are showing you a pretty line on the chart, not a result.
The version that works appeared only when the channel was doubled in width and sells were banned, that is, when the breakout system turned into a way of buying gold when its rally accelerates. It is an honest robot for a specific market, not a universal holy grail. If gold’s trend changes, the result will change.
Today I also published the analysis of Hosoda’s Ichimoku: there too only the optimized variant survived, but on bitcoin. Other analyses: Parabolic SAR + ADX (which also found its money in gold), the inside bar breakout and mean reversion with Bollinger Bands, exactly the opposite of a breakout.
Why 72 months?
The market changes fundamentally every 3–5 years: the participants and the volatility change, and trends give way to ranges. Gold in this test is a living example. In 2021–2023 it spent years moving in a corridor, and channel breakouts almost always turned out to be false. Starting in 2024 a different market began: a long rally, where every strong move up continued. The same system first lost and then won. A 10–20 year test would have mixed those phases into a single figure and would tell you nothing about what to do now. You have to choose a strategy for the current market, and change it when the market changes.
For that I built my app “Find your strategy”, in the browser or on Telegram. There you can test any idea on a history of up to 72 months, and every 2 weeks the app automatically runs tens of thousands of strategies and shows you the ones that work over the last 6, 12 and 36 months. It doesn’t promise profits: it shows you which ideas are still alive in the market that exists today.
Backtest results do not guarantee future results.
Sources
- Chester W. Keltner — “How to Make Money in Commodities,” 1960: the 10-day moving average rule (Keltner channel).
- Linda Bradford Raschke — the modern version of the channel based on EMA and ATR.
- My own tests in MetaTrader 5 on the FxPro demo server, October 2026.
Where to trade
These are the brokers and exchanges I use that work with clients from Latin America. Always check that the service is available in your country and start small.
Risk warning: CFDs, Forex and crypto derivatives carry a high risk of losing money due to leverage. This article is not investment advice.