The market has calmed down: candles keep getting smaller and price isn’t moving. It looks like the spring is about to snap, and whoever gets in first will catch the whole move. One of Toby Crabel’s best-known patterns, the NR7, was built on that idea: wait for the narrowest candle of the last seven and enter in the direction it breaks. The rule is simple and easy to code, which is why it gets repeated in books and forums. I wrote a robot with the classic rules and ran it on seven markets over 72 months. Here is what came out and which robot is better to use instead.
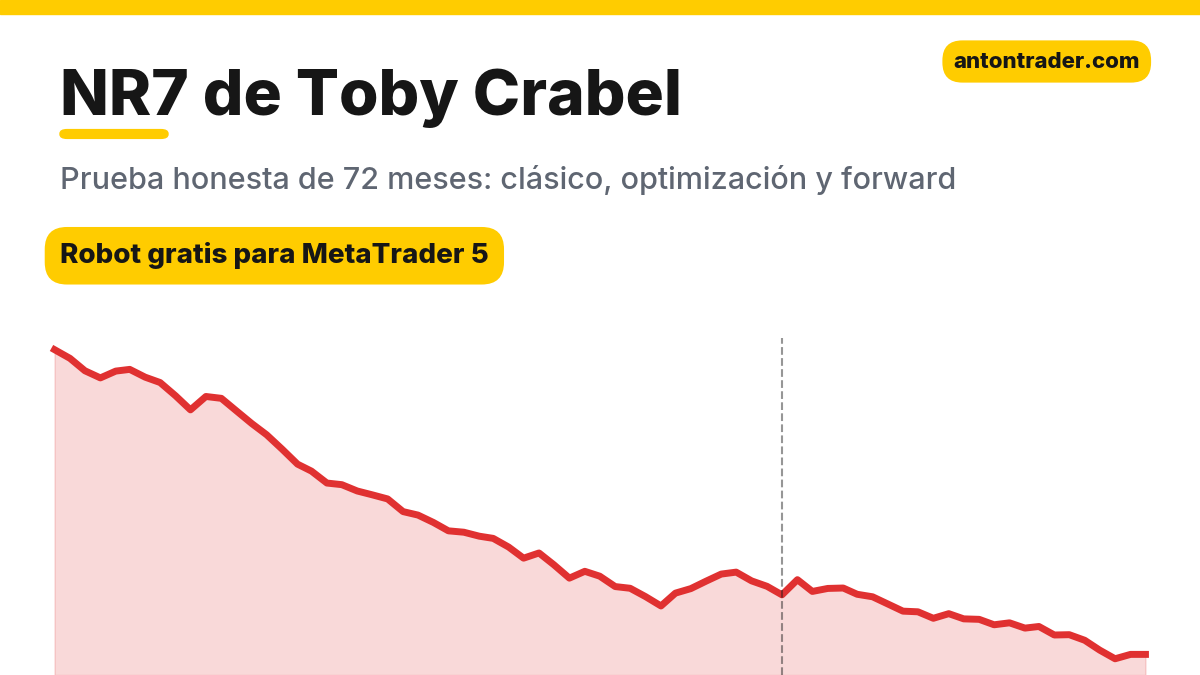
- The classic doesn’t work. NR7 on D1 over 72 months: only USDJPY was positive (+3.9% in six years); on the other markets, losses went as deep as −38.1% (USDCHF).
- The cause: the breakout of a narrow candle is a coin flip. False breakouts close at the full stop, and on the true ones the classic holds the trade only until the end of the day.
- Optimization didn’t save it: on USDJPY H4, of 44 profitable sets in training, only 11 stayed positive in the forward test, and the best one had a profit factor of just 1.18 in the forward.
- What works better: the TTM Squeeze robot, the same “compression before the move” idea, but trading with the trend: +55% over 72 months on gold with a 4.7% drawdown, forward +36%.
📊 Download the TTM Squeeze robot for free, the one that does work
The strategy rules
The NR7 (Narrow Range 7) was described by Toby Crabel in the book “Day Trading with Short Term Price Patterns and Opening Range Breakout” (1990). He noticed that after days with an unusually narrow range, the market more often makes a strong move. Later the idea was popularized by Linda Raschke and Laurence Connors in “Street Smarts” (the NR4 variant with an inside bar). The most commonly repeated rules:
- Signal: yesterday’s candle has the narrowest range (high to low) of the last 7 days.
- Entry: today, if price breaks the high of that candle, buy; if it breaks the low, sell. One trade only, in the direction where the breakout happened first.
- Stop: on the other side of the narrow candle.
- Exit: at the end of the entry day. Crabel traded the NR7 intraday.
- Position size: based on a risk of 1% of the balance per trade.
What it looks like on the chart
Below are two real trades from the robot, from the best set the optimizer found on USDJPY H4, and both come from the forward period. The dotted box marks the seven candles; the purple one is the narrowest of them.
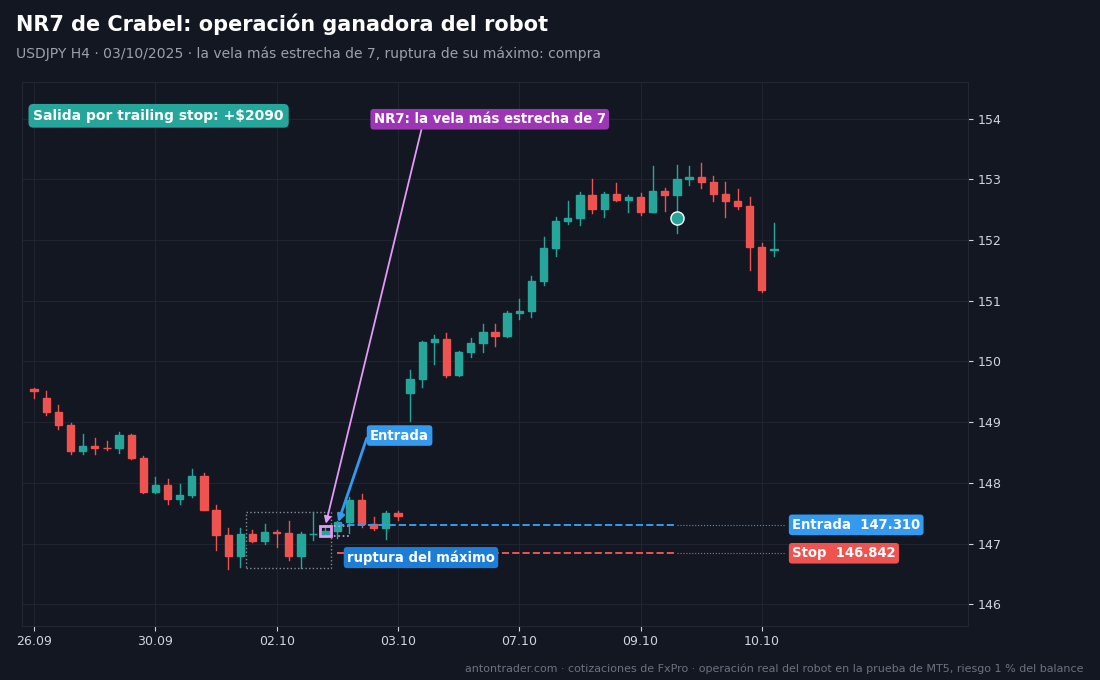
The trade that makes the strategy so appealing. On October 2, 2025, the narrowest candle of seven appeared on USDJPY H4. On the next candle price broke its high, and the robot bought at 147.310, with the stop at 146.842. The spring really did snap: within a week the pair rose five yen, the trailing stop followed the trade, and it closed on October 9: +$2,090.
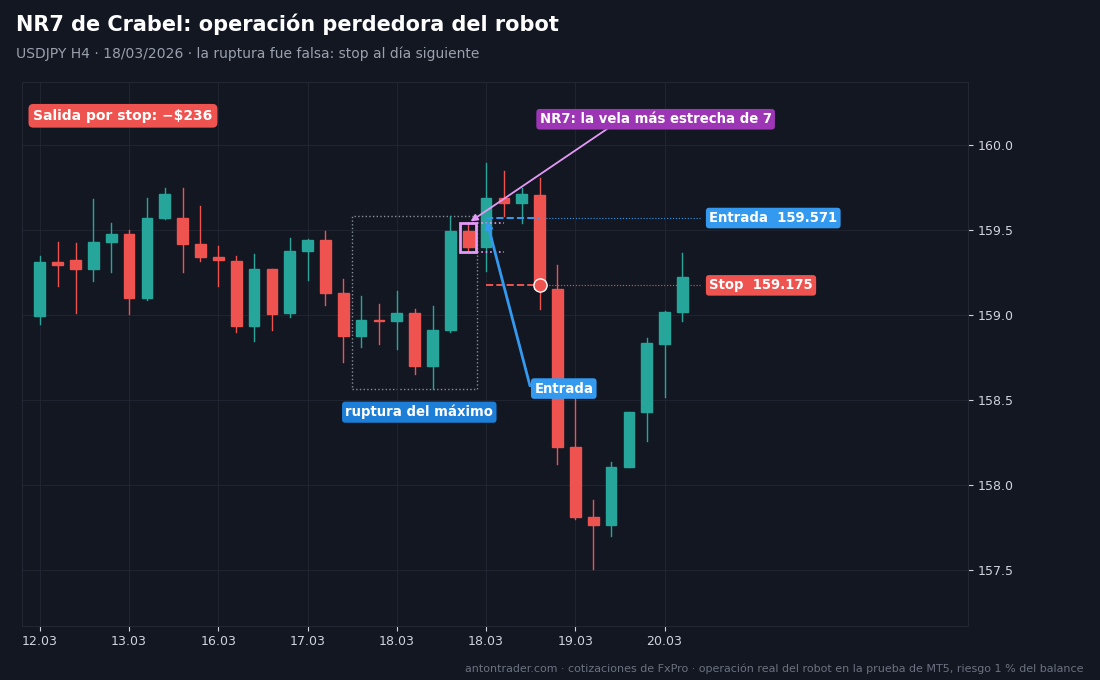
The trade that happens far more often. On March 18, 2026, the setup was the same: narrow candle, breakout of the high, buy at 159.571, stop at 159.175. But the breakout was false: price reversed, the next morning it hit the stop and kept falling almost two yen: −$236. The problem is that you can’t tell these two pictures apart in advance: at the moment of entry they look the same.
Manually it looks like this: find a candle whose range is smaller than each of the previous six. Place a Buy Stop order above its high and a Sell Stop below its low; when one triggers, delete the other. Stop on the other side of the narrow candle. It looks very pretty in the history, when you already know which breakout was the real one.
How I ran the test
MetaTrader 5 Strategy Tester, a demo account from FxPro with its quotes, spreads, commissions and swaps. Period: October 2020 to October 2026, 72 months. Deposit of $10,000, leverage 1:500, “1 minute OHLC” mode: the robot sees how price moved inside the candle and enters at the moment of the breakout, as with a pending order. I’ll explain why exactly 72 months at the end of the article.
NR7 over 72 months: positive on only one market
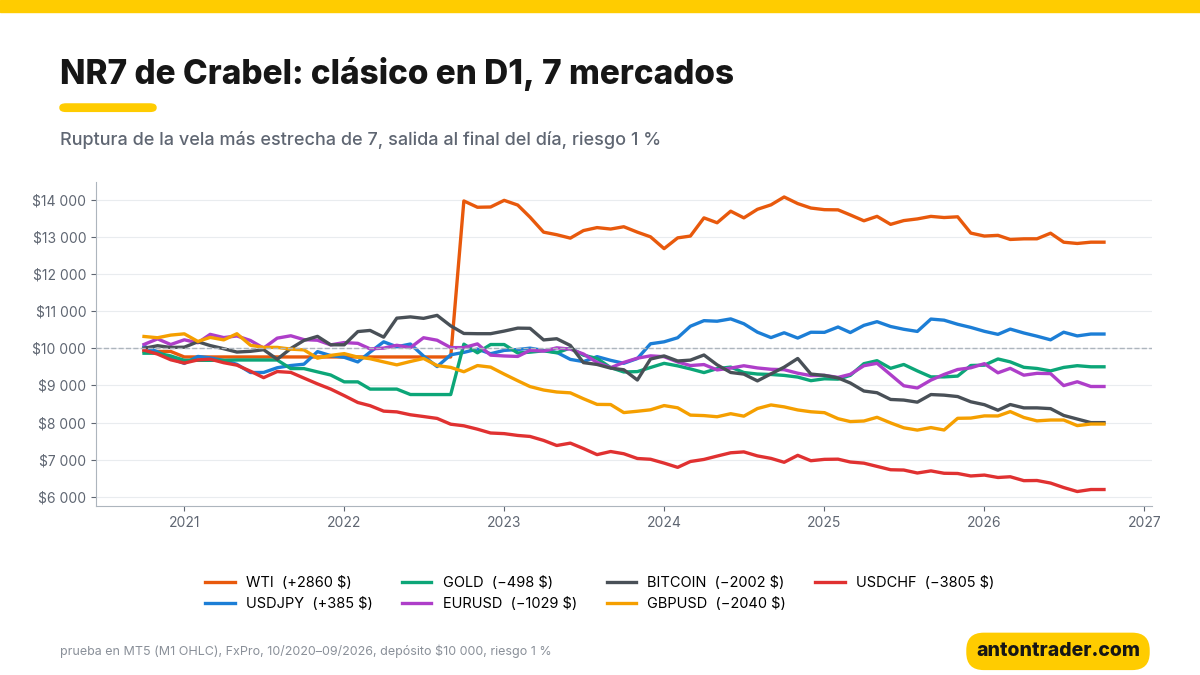
| Instrument (D1) | Result | Profit factor | Max drawdown | Winning trades |
|---|---|---|---|---|
| WTI (oil)* | +28.6% | 1.44 | 30.2% | 48% |
| USDJPY | +3.9% | 1.05 | 8.5% | 44% |
| GOLD | −5.0% | 0.91 | 18.2% | 42% |
| EURUSD | −10.3% | 0.86 | 15.3% | 44% |
| BITCOIN | −20.0% | 0.81 | 28.5% | 39% |
| GBPUSD | −20.4% | 0.72 | 26.3% | 42% |
| USDCHF | −38.1% | 0.44 | 39.2% | 35% |
* The positive result on oil is a data accident: the tester’s WTI quote history is missing the period from early 2021 to October 2022, and a single buy “hung” through that whole gap and made $3,033. Without it, NR7 on oil gives about −1.7%. The honest result: there is no clear positive on any market, and USDJPY gave +3.9% in six years, less than 1% a year. There are three reasons:
- The direction of the breakout is a coin flip. The narrow candle says a move is coming soon, but not which way. The robot enters on the first side that breaks, and a bit less than half of those entries turn out to be right.
- The trade lives very briefly. Exiting at the end of the day cuts off exactly the moves the NR7 was invented for: the spring snaps, but the trade is already closed.
- The stop behind the narrow candle is small, but costs are not. With a tight stop the position is large, and the spread and commission eat a noticeable part of every gain.
The same classic rules on USDJPY H4 work even worse: −89.9% over 72 months. On H4 there are more narrow candles, and among them, even more false breakouts.
What if optimization saves it?
I gave the optimizer freedom: NR4 or NR7, inside bar filter, stop behind the candle or at 1–2 ATR, take profit of 1 to 3 stops, trailing stop, a time limit on the trade, trend filter by EMA 100 or 200, buys only or both sides. Markets: USDJPY H4 and oil on D1. The optimization was done only on 10/2020–09/2024, and then I checked what it found on 10/2024–09/2026, months the optimizer never saw.
- USDJPY H4: of 44 profitable sets in training, only 11 stayed positive in the forward test. The other 33 “worked” only on the data they were fitted to.
- WTI D1: of 84 profitable sets in training, 16 stayed positive in the forward test, and that’s with quotes that have a gap I don’t trust.
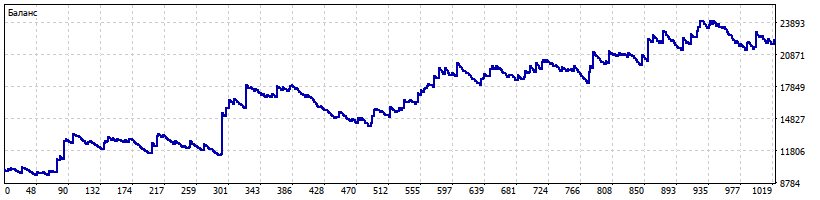
- The best survivor on USDJPY H4: NR7, buys only, 1 ATR stop, 6-candle trailing stop: in training +87.2% with a profit factor of 1.29, in the forward +19.3% with a profit factor of 1.18. Over 72 months, +124.4% with a 23.6% drawdown.
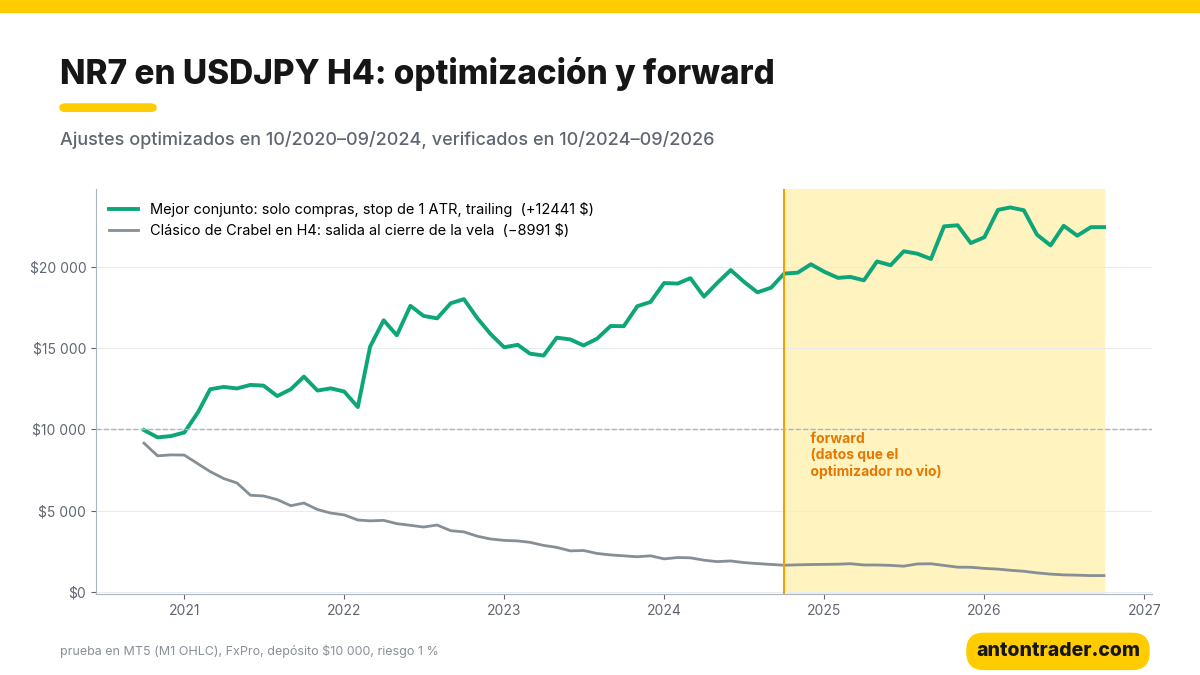
The +124% looks pretty, but I don’t recommend this set, and here’s why. First, a profit factor of 1.18 in the forward is below my threshold of 1.3: for every dollar lost, the robot made just 1.18. An edge like that disappears easily with a slightly wider spread at another broker. Second, this is no longer Crabel’s NR7: “buys only on USDJPY” in the years when the pair rose from 105 to 160 is a bet on the trend, not on the breakout of a narrow candle. The swaps on the buys added up to $2,293, almost the same as what commissions took ($2,258). And third, when only 11 of 44 profitable sets in training survive, that looks more like luck than an edge.
What to use instead of NR7: robots that passed the test
If you like the idea of “the market compressed and now it’s going to take off,” use a robot that catches the same compression but enters with the trend, or robots that held up under verification on data the optimizer never saw:
| Robot | Over 72 months | Max drawdown | Forward 10/2024–09/2026 |
|---|---|---|---|
| TTM Squeeze, GOLD H4 | +55.0% | 4.7% | +36.1%, profit factor 2.73 |
| Raschke’s “80-20”, GOLD H4 | +74.2% | 17.1% | +24.8%, profit factor 1.84 |
| “Holy Grail”, USDJPY H4 | +69.3% | 8.7% | +20.7%, profit factor 2.39 |
| For comparison: classic NR7 (7 markets, D1) | from +3.9% to −38.1% | up to 39.2% | — |
📊 Download the TTM Squeeze robot for gold
📊 Download the “80-20” robot for gold
Where to run them and how to download them
The robots work in MetaTrader 5 with any broker. My test was done at FxPro. The other brokers in my ranking also work: RoboForex and Tickmill. The robots are free for clients of these brokers:
- Open a MetaTrader 5 account with one of the brokers above (or use the one you already have).
- Go to the Telegram bot with the button and send your account number.
- After verification, the bot sends you the file: the robot, the ready-made parameters and the instructions. Run it in your broker’s tester, it takes an afternoon, and then put it into operation.
If you want to check the narrow-candle breakouts yourself, the bot also has the NR7 robot, with the classic and the optimized parameters, to experiment with in the tester. It’s not a good idea to put it on a real account.
My conclusion
The NR7 is a correct observation: after calm, the market really does make a strong move more often. But an observation and a trading system are different things. The narrow candle doesn’t say which way price will go, false breakouts close at the full stop, and the end-of-day exit cuts off the true moves. Over 72 months the classic didn’t win clearly on any market, and the best optimized set rests on the USDJPY trend and on swaps, not on the idea itself. Protect your deposit: volatility compression is best traded together with the direction of the trend. To trade, use a robot that passed the test, for example TTM Squeeze: it catches the same compression, but enters with the trend.
Today I also published the analysis of Linda Raschke’s “80-20” robot, which passed the test on gold. Other breakout strategies: Larry Williams’ volatility breakout and the London first-hour breakout. Earlier, Turtle Soup, the martingale grid and the double top and double bottom also failed the test.
Why 72 months?
The market changes fundamentally every 3–5 years: the participants and the volatility change, and trends give way to ranges. That’s why I don’t run 10–20 year tests: they blend different markets into a single average figure, and when the market changes, you have to change the strategy anyway. The NR7 is a clear example. Crabel described it in 1990 for a market in which a breakout after calm usually produced a move for the whole day. In 2020–2026, even the best optimized set held up on the trend of a single pair, not on the compression itself. You have to trade the market that exists today.
To look for strategies for the current market I built my app “Find your strategy”, in the browser or in Telegram. There you can test any idea on a history of up to 72 months, and every 2 weeks the app automatically runs tens of thousands of strategies and shows you the ones that work over the last 6, 12 and 36 months. It doesn’t promise profits: it helps you notice in time that the market has changed and that an old idea has stopped working.
Backtest results do not guarantee future results.
Sources
- Toby Crabel: “Day Trading with Short Term Price Patterns and Opening Range Breakout” (Traders Press, 1990): the NR7 pattern and the breakout trade after a narrow day.
- Linda Bradford Raschke and Laurence A. Connors: “Street Smarts: High Probability Short-Term Trading Strategies” (M. Gordon Publishing, 1995), chapter “ID/NR4”.
- Own tests in MetaTrader 5 on the FxPro demo server, October 2026.
Where to trade
These are the brokers and exchanges I use that work with clients from Latin America. Always check that the service is available in your country, and start small.
Risk warning: CFDs, Forex and crypto derivatives carry a high risk of losing money due to leverage. This article is not investment advice.